
Spot Ethereum ETF inflows outpace Bitcoin ETFs: Can ETH break $1,933 resistance?

Ethereum (ETH) is trading at $1,924.75, posting a modest day-on-day gain and remaining below its key moving averages.
 1894.45
1981.24
1894.45
1981.24
Highlights
- U.S. spot Ethereum ETFs recorded $37.47 million in net inflows on July 21, 2026, extending a run of rising institutional demand.
- Ethereum investment products outpaced Bitcoin ETFs in inflows last week and benefited from stronger market engagement, as shown by a full validator entry queue.
- ETH/USD trades below key moving averages with dominant selling pressure, and is projected to range between $1,860 and $1,959, with downside favored in the near term.
Institutional inflows rise as spot Ethereum ETFs outpace Bitcoin
Spot Ethereum ETFs in the U.S. posted net inflows of $37.47 million on July 21, 2026, marking the third consecutive day of positive institutional demand, according to Cryptorank. This builds on the prior week's net inflows of $105.44 million, which surpassed Bitcoin ETFs for the same period and reflect growing capital allocation to Ethereum vehicles, as reported by Wallstreet Online. Additional support for market participation comes from heightened staking interest, with the validator exit queue dropping to zero and a sizable entry queue as of July 22, 2026, according to Cryptotimes, while developments such as BlackRock's ETHA ETF leadership in daily inflows and new protocol security efforts further shape sentiment.
Conflicting momentum signals amid resistance at short-term averages
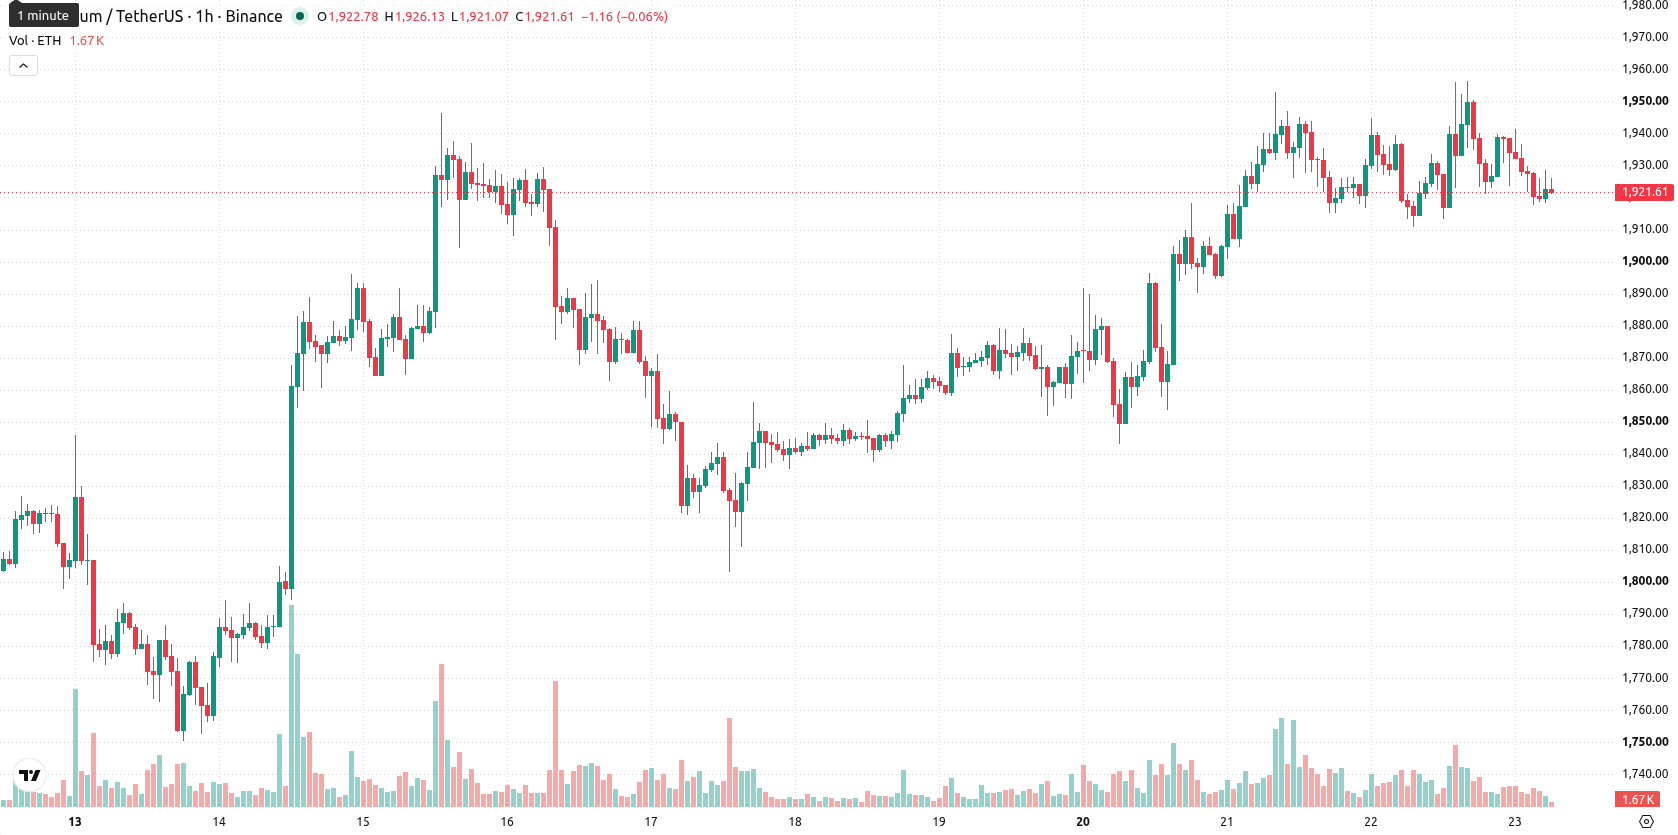
On the technical front, ETH/USD is trading below the hourly MA-20 at $1,931 and MA-50 at $1,930, and remains well under the MA-200 at $2,167. The Ichimoku Kijun is positioned at $1,933, acting as immediate resistance. Momentum readings are mixed: MACD is Neutral, ADX points to a Buy, while oscillators diverge — RSI is at 48.05 with a Sell signal, CCI also signals Sell, Stoch RSI registers a Strong Buy, and Bull/Bear Power is Oversold, reflecting seller dominance. The Awesome Oscillator is Neutral, providing no additional trend signal. Diverging intraday momentum and oscillator signals capture increased uncertainty about short-term direction.
Rangebound outlook as downside risk edges out upside
Over the next 2–3 trading days, ETH/USD is expected to fluctuate within a range of $1,860 to $1,959, reflecting typical volatility levels relative to current prices. There is a slightly higher probability of a downward move (53%) than an upside reversal (47%). The base scenario anticipates sideways price action within this band, with a bullish outcome possible if resistance near $1,933 breaks, and further downside risk if support at $1,860 fails.
Earlier, analysts noted that Ethereum was facing persistent technical headwinds and limited upside momentum despite increasing institutional inflows. The latest data indicating robust ETF inflows alongside mixed momentum signals suggests that traders should remain alert to a potential shift in direction if ETH decisively breaks above immediate resistance at $1,933.


Latest Ethereum News







-
 Afghanistan
-
 Albania
-
 Algeria
-
 Angola
-
 Argentina
-
 Armenia
-
 Australia
-
 Austria
-
 Azerbaijan
-
 Bahamas
-
 Bahrain
-
 Bangladesh
-
 Belarus
-
 Belgium
-
 Bolivia
-
 Botswana
-
 Brazil
-
 Brunei
-
 Bulgaria
-
 Cambodia
-
 Cameroon
-
 Canada
-
 Chile
Chile
-
 China
China
-
 Colombia
-
 Congo
Congo
-
 Costa Rica
-
 Cote d'Ivoire
-
 Croatia
-
 Cuba
Cuba
-
 Cyprus
-
 Czechia
-
 DR Congo
-
 Denmark
-
 Dominican Republic
-
 Ecuador
-
 Egypt
Egypt
-
 El Salvador
-
 Estonia
-
 Eswatini
-
 Ethiopia
-
 Finland
-
 France
-
 Georgia
-
 Germany
-
 Ghana
Ghana
-
 Greece
-
 Haiti
Haiti
-
 Hong Kong
-
 Hungary
-
 India
India
-
 Indonesia
-
 Iran, Islamic republic
-
 Iraq
Iraq
-
 Ireland
-
 Israel
-
 Italy
Italy
-
 Jamaica
-
 Japan
Japan
-
 Jordan
-
 Kazakhstan
-
 Kenya
Kenya
-
 Korea
Korea
-
 Kuwait
-
 Kyrgyzstan
-
 Laos
Laos
-
 Latvia
-
 Lebanon
-
 Lesotho
-
 Libya
Libya
-
 Lithuania
-
 Luxembourg
-
 Madagascar
-
 Malaysia
-
 Malta
Malta
-
 Mauritius
-
 Mexico
-
 Moldova
-
 Mongolia
-
 Montenegro
-
 Morocco
-
 Mozambique
-
 Myanmar
-
 Namibia
-
 Nepal
Nepal
-
 Netherlands
-
 New Zealand
-
 Nigeria
-
 North Macedonia
-
 Norway
-
 Oman
Oman
-
 Pakistan
-
 Palestine
-
 Panama
-
 Papua New Guinea
-
 Paraguay
-
 Peru
Peru
-
 Philippines
-
 Poland
-
 Portugal
-
 Puerto Rico
-
 Qatar
Qatar
-
 Reunion
-
 Romania
-
 Rwanda
-
 Saudi Arabia
-
 Serbia
-
 Singapore
-
 Slovakia
-
 Slovenia
-
 Somalia
-
 South Africa
-
 Spain
Spain
-
 Sri Lanka
-
 Sweden
-
 Switzerland
-
 Syria
Syria
-
 Taiwan
-
 Tajikistan
-
 Tanzania
-
 Thailand
-
 Trinidad and Tobago
-
 Tunisia
-
 Turkey
-
 UAE
UAE
-
 Uganda
-
 Ukraine
-
 United Kingdom
-
United States
-
 Uruguay
-
 Uzbekistan
-
 Venezuela
-
 Vietnam
-
 Yemen
Yemen
-
 Zambia
-
 Zimbabwe
- Forex
- Crypto












