

Curve gains over 11% after trading above key moving averages and intraday buying interest

Curve (CRV) surged 11.26% as robust technical momentum and strong buying pressure drove an intraday advance. The move is supported by CRV trading above its 20-, 50-, and 200-day moving averages, with price action pushing toward immediate resistance levels.
 0.3432
0.3996
0.3432
0.3996
Highlights
- CRV/USD trades above its short, medium, and long-term moving averages, indicating sustained upside momentum across time frames.
- Technical indicators show robust buy signals and dominance by buyers intraday, but Stochastic RSI and CCI warn of an overbought market.
- For the next five trading days, the expected range is $0.2434 to $0.288, with an over 80% probability of an upward move.
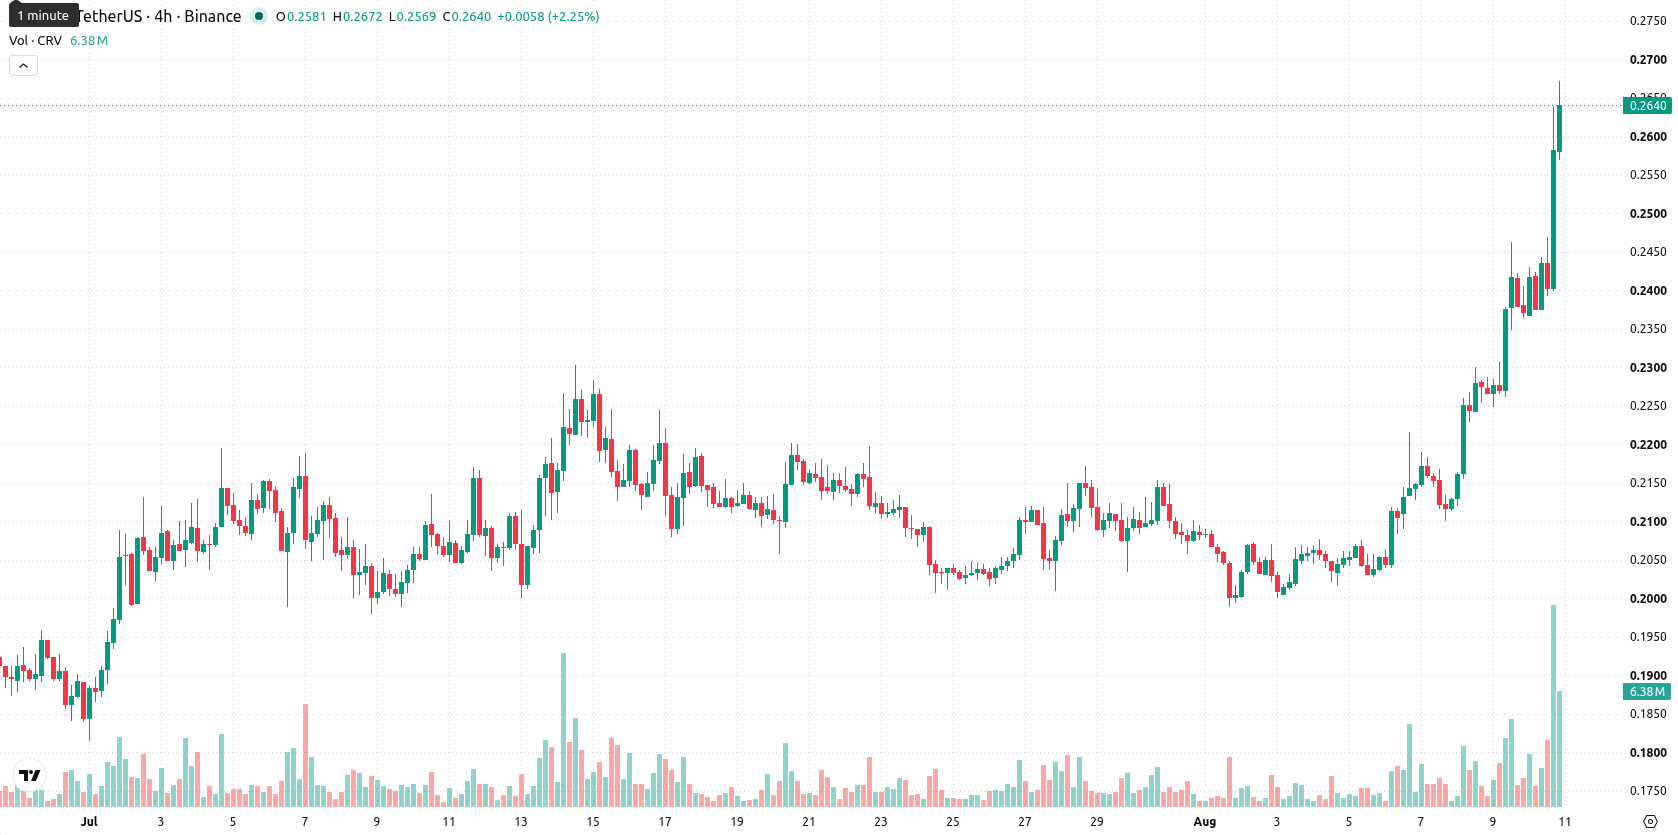
Overbought signals rise as bullish momentum meets resistance and volatility
CRV/USD is trading above its 20-, 50-, and 200-day moving averages at $0.2107, $0.208, and $0.2323, indicating positive momentum across short, medium, and long-term trends. The configuration supports further upside potential in the near term, with immediate resistance at $0.288 and the nearest support at $0.2639. Momentum readings remain robust, with the MACD signaling buy and the ADX neutral, suggesting that trending conditions are still emerging. The RSI is near 70, and both the Stochastic RSI and CCI are signaling overbought conditions. Bull/Bear Power (BBP) is positive, reflecting intraday dominance by buyers, but elevated overbought levels highlight increased short-term risk. Daily gains stand at $0.0269, or 11.26%, after a minor downside gap of around -0.84%. The current price remains near session highs with intraday volatility at 11.49%, underscoring the strong upward movement.
Previously it was reported that Curve was demonstrating strong short-term momentum and bullish technical signals, with further advances dependent on a confirmed breakout. The current analysis reinforces this outlook, highlighting a prevailing scenario of sideways consolidation with a high probability of continued upside, while traders should closely monitor the $0.288 resistance as the critical level for the next directional move.








-
 Afghanistan
-
 Albania
-
 Algeria
-
 Angola
-
 Argentina
-
 Armenia
-
 Australia
-
 Austria
-
 Azerbaijan
-
 Bahamas
-
 Bahrain
-
 Bangladesh
-
 Belarus
-
 Belgium
-
 Bolivia
-
 Botswana
-
 Brazil
-
 Brunei
-
 Bulgaria
-
 Cambodia
-
 Cameroon
-
 Canada
-
 Chile
Chile
-
 China
China
-
 Colombia
-
 Congo
Congo
-
 Costa Rica
-
 Cote d'Ivoire
-
 Croatia
-
 Cuba
Cuba
-
 Cyprus
-
 Czechia
-
 DR Congo
-
 Denmark
-
 Dominican Republic
-
 Ecuador
-
 Egypt
Egypt
-
 El Salvador
-
 Estonia
-
 Eswatini
-
 Ethiopia
-
 Finland
-
 France
-
 Georgia
-
 Germany
-
 Ghana
Ghana
-
 Greece
-
 Haiti
Haiti
-
 Hong Kong
-
 Hungary
-
 India
India
-
 Indonesia
-
 Iran, Islamic republic
-
 Iraq
Iraq
-
 Ireland
-
 Israel
-
 Italy
Italy
-
 Jamaica
-
 Japan
Japan
-
 Jordan
-
 Kazakhstan
-
 Kenya
Kenya
-
 Korea
Korea
-
 Kuwait
-
 Kyrgyzstan
-
 Laos
Laos
-
 Latvia
-
 Lebanon
-
 Lesotho
-
 Libya
Libya
-
 Lithuania
-
 Luxembourg
-
 Madagascar
-
 Malaysia
-
 Malta
Malta
-
 Mauritius
-
 Mexico
-
 Moldova
-
 Mongolia
-
 Montenegro
-
 Morocco
-
 Mozambique
-
 Myanmar
-
 Namibia
-
 Nepal
Nepal
-
 Netherlands
-
 New Zealand
-
 Nigeria
-
 North Macedonia
-
 Norway
-
 Oman
Oman
-
 Pakistan
-
 Palestine
-
 Panama
-
 Papua New Guinea
-
 Paraguay
-
 Peru
Peru
-
 Philippines
-
 Poland
-
 Portugal
-
 Puerto Rico
-
 Qatar
Qatar
-
 Reunion
-
 Romania
-
 Rwanda
-
 Saudi Arabia
-
 Serbia
-
 Singapore
-
 Slovakia
-
 Slovenia
-
 Somalia
-
 South Africa
-
 Spain
Spain
-
 Sri Lanka
-
 Sweden
-
 Switzerland
-
 Syria
Syria
-
 Taiwan
-
 Tajikistan
-
 Tanzania
-
 Thailand
-
 Trinidad and Tobago
-
 Tunisia
-
 Turkey
-
 UAE
UAE
-
 Uganda
-
 Ukraine
-
 United Kingdom
-
United States
-
 Uruguay
-
 Uzbekistan
-
 Venezuela
-
 Vietnam
-
 Yemen
Yemen
-
 Zambia
-
 Zimbabwe
- Forex
- Crypto












