

Curve weekly forecast: Maintains range near support as volatility persists into next week

Curve (CRV) is holding near $0.24 after climbing about 6% over the past week as buyers retained control and sustained upward momentum. Corporate actions have been front and center, and the market is watching whether support holds and volatility persists heading into next week.
 0.3698
0.3996
0.3698
0.3996
Highlights
- Curve trades at $0.2409, up 5.84% over the past 7 days, maintaining a position above key trend levels.
- MACD and Bull/Bear Power register buy signals, but oscillators are neutral and Awesome Oscillator turns neutral, showing mixed momentum.
- Curve is projected to trade between $0.2146 and $0.2671, with support at $0.2367 and resistance at $0.2426.
Llamalend V2 rollout and new caps reshape crvUSD lending dynamics
Curve announced it will deploy Llamalend V2 on Ethereum mainnet in July 2026, introducing three new isolated lending markets for assets including sDOLA and sfrxUSD, as reported on its official site. Governance approvals set new borrowing caps of $12.4 million and $28.4 million crvUSD, driving a notable decrease in average crvUSD borrow rates and a sizable 29% expansion in borrower-minted crvUSD during the rollout. The introduction of the HyperbolicMP monetary policy class was also a highlight, approved for both mainnet and Optimism V2 markets and likely influencing lending activity in the week ahead.
Indecision follows weekly rally as technical signals diverge near resistance
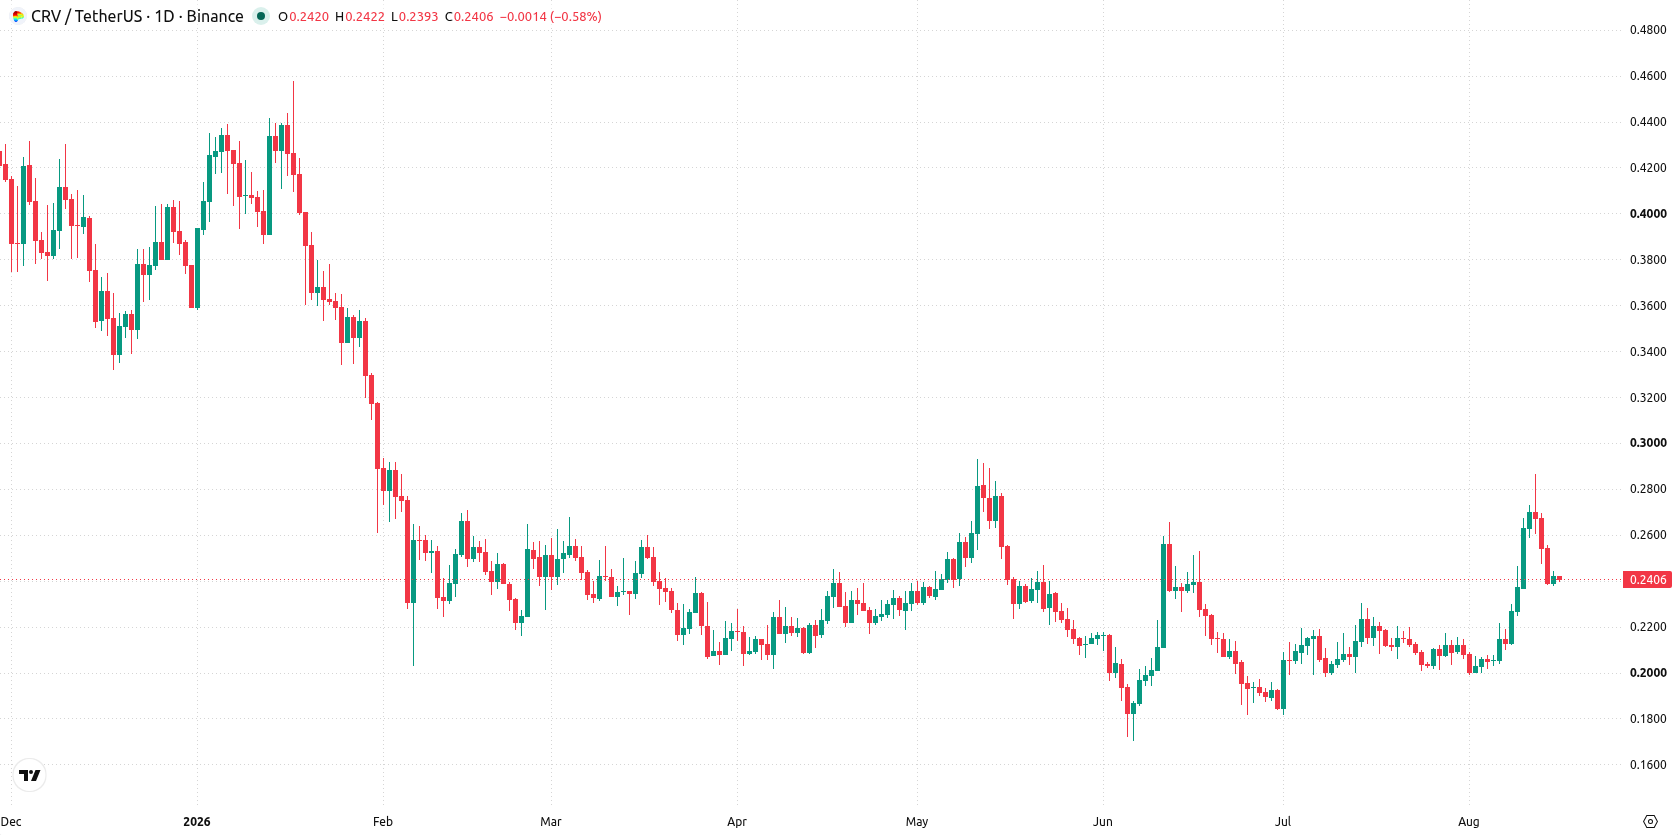
On the daily timeframe, structure is positive but still developing, supported by a recent sharp move higher without a sustained trend. MACD and Bull/Bear Power both register buy signals, which aligns with building upward momentum. With volatility running at 21%, price is squeezed near support at $0.2367 and just below resistance at $0.2426 (the Ichimoku Kijun), while oscillators such as RSI and Stoch RSI remain neutral, suggesting indecision around current levels. Momentum signals contradict slightly, as Awesome Oscillator turns neutral, pointing to the need for confirmation of a follow-through move.
Choppy price action forecast as breakout risks emerge next week
For the next 7 days, Curve is expected to trade between $0.2146 and $0.2671. There is a 79% probability of an increase and a 21% chance of a decrease. The base case is choppy action holding between support at $0.2367 and resistance at $0.2426. A decisive break above $0.2426 would likely open upside risk toward the $0.2671 region, while a drop below $0.2367 brings the lower end of the forecast range, $0.2146, into focus.
Previously, it was reported that Curve faced persistent selling pressure and elevated volatility, with downside risks dominating the technical outlook. The current analysis adds a new dimension by highlighting the impact of recent protocol developments on lending dynamics, with traders advised to monitor price behavior around the $0.2426 resistance level for clues on near-term direction.









-
 Afghanistan
-
 Albania
-
 Algeria
-
 Angola
-
 Argentina
-
 Armenia
-
 Australia
-
 Austria
-
 Azerbaijan
-
 Bahamas
-
 Bahrain
-
 Bangladesh
-
 Belarus
-
 Belgium
-
 Bolivia
-
 Botswana
-
 Brazil
-
 Brunei
-
 Bulgaria
-
 Cambodia
-
 Cameroon
-
 Canada
-
 Chile
Chile
-
 China
China
-
 Colombia
-
 Congo
Congo
-
 Costa Rica
-
 Cote d'Ivoire
-
 Croatia
-
 Cuba
Cuba
-
 Cyprus
-
 Czechia
-
 DR Congo
-
 Denmark
-
 Dominican Republic
-
 Ecuador
-
 Egypt
Egypt
-
 El Salvador
-
 Estonia
-
 Eswatini
-
 Ethiopia
-
 Finland
-
 France
-
 Georgia
-
 Germany
-
 Ghana
Ghana
-
 Greece
-
 Haiti
Haiti
-
 Hong Kong
-
 Hungary
-
 India
India
-
 Indonesia
-
 Iran, Islamic republic
-
 Iraq
Iraq
-
 Ireland
-
 Israel
-
 Italy
Italy
-
 Jamaica
-
 Japan
Japan
-
 Jordan
-
 Kazakhstan
-
 Kenya
Kenya
-
 Korea
Korea
-
 Kuwait
-
 Kyrgyzstan
-
 Laos
Laos
-
 Latvia
-
 Lebanon
-
 Lesotho
-
 Libya
Libya
-
 Lithuania
-
 Luxembourg
-
 Madagascar
-
 Malaysia
-
 Malta
Malta
-
 Mauritius
-
 Mexico
-
 Moldova
-
 Mongolia
-
 Montenegro
-
 Morocco
-
 Mozambique
-
 Myanmar
-
 Namibia
-
 Nepal
Nepal
-
 Netherlands
-
 New Zealand
-
 Nigeria
-
 North Macedonia
-
 Norway
-
 Oman
Oman
-
 Pakistan
-
 Palestine
-
 Panama
-
 Papua New Guinea
-
 Paraguay
-
 Peru
Peru
-
 Philippines
-
 Poland
-
 Portugal
-
 Puerto Rico
-
 Qatar
Qatar
-
 Reunion
-
 Romania
-
 Rwanda
-
 Saudi Arabia
-
 Serbia
-
 Singapore
-
 Slovakia
-
 Slovenia
-
 Somalia
-
 South Africa
-
 Spain
Spain
-
 Sri Lanka
-
 Sweden
-
 Switzerland
-
 Syria
Syria
-
 Taiwan
-
 Tajikistan
-
 Tanzania
-
 Thailand
-
 Trinidad and Tobago
-
 Tunisia
-
 Turkey
-
 UAE
UAE
-
 Uganda
-
 Ukraine
-
 United Kingdom
-
United States
-
 Uruguay
-
 Uzbekistan
-
 Venezuela
-
 Vietnam
-
 Yemen
Yemen
-
 Zambia
-
 Zimbabwe
- Forex
- Crypto












