

IOTA climbs about 12.5% as short-term momentum turns bullish

IOTA (IOTA) surged 12.46% on strong technical momentum, with buyers dominating as price action opened with an upside gap and held near the top of the session’s range. The move looks limited, as IOTA remains capped below its 200-day moving average and longer-term bearish trend structure persists.
 0.05
0.0552
0.05
0.0552
Highlights
- IOTA trades above short- and medium-term averages but remains under long-term resistance, indicating ongoing bearish structural pressure.
- Momentum indicators are mixed, with some showing bullish or overbought conditions and others still negative or neutral.
- The expected five-day price range is $0.0351 to $0.04, with a 59% probability of an upward move and possible consolidation near current levels.
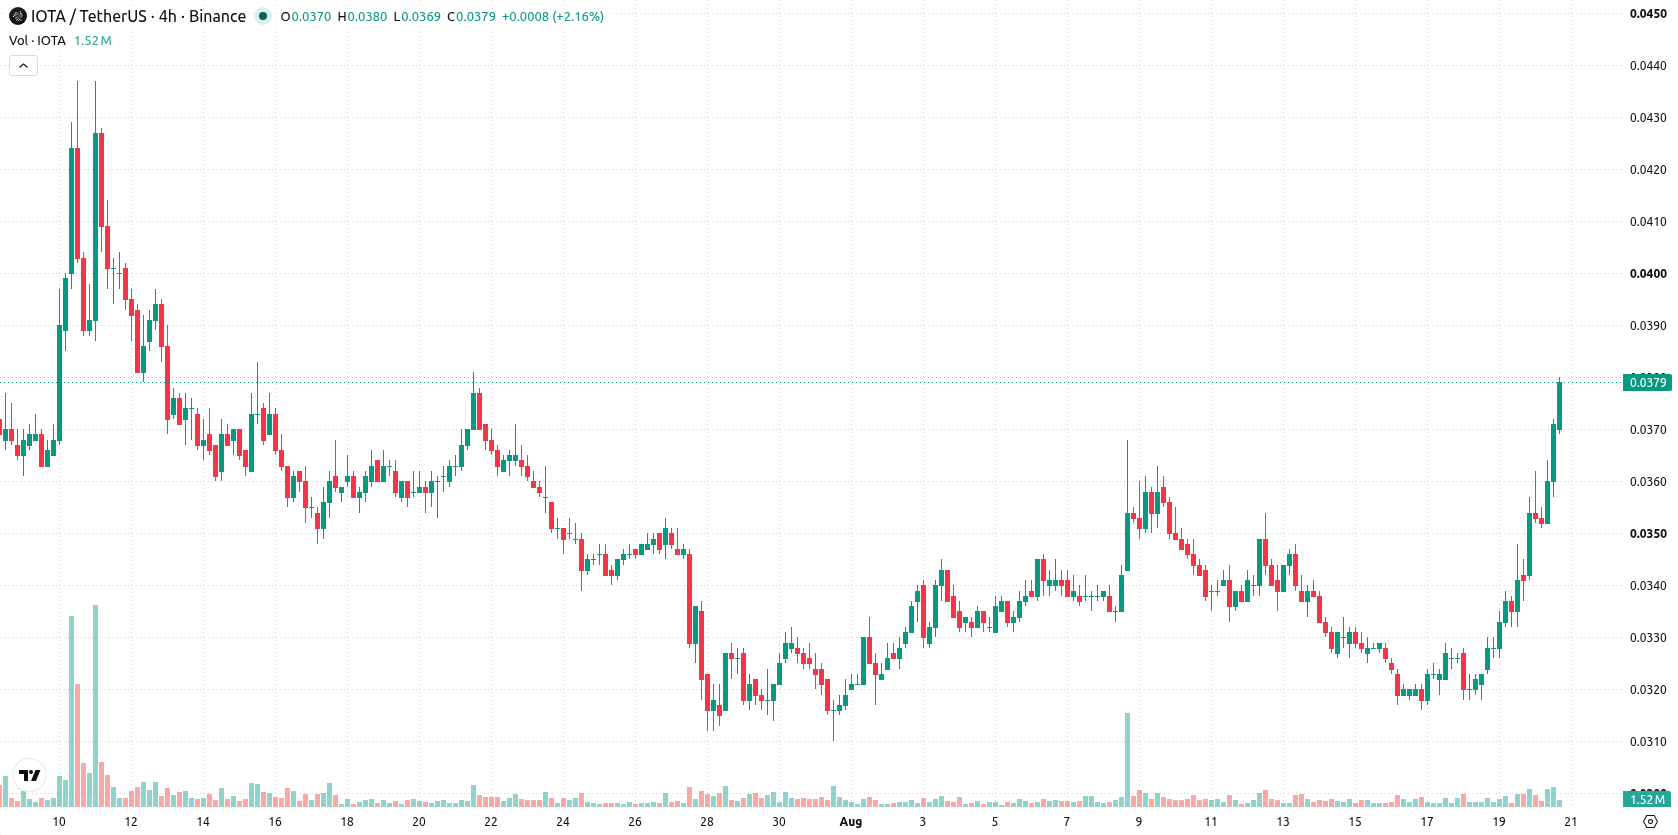
Short-term bullish momentum faces mixed signals and key resistances
IOTA is trading above both its 20-day and 50-day moving averages (MA-20: $0.0335, MA-50: $0.0352), indicating positive short- and medium-term momentum, but remains below its 200-day moving average (MA-200: $0.0525), reflecting ongoing longer-term pressure from sellers and a bearish longer-term trend structure. The nearest technical floor is the near-term high at $0.0376, with the ceiling at $0.04. Distant levels such as the Ichimoku Kijun ($0.0339) and the 200-day MA remain well below or above the current price and serve only as context for the broader trend. Momentum signals present a mixed picture: the MACD remains negative and in strong sell territory, and the ADX indicates a neutral trend at low levels. The RSI stands at 56, leaning bullish, and CCI is also supportive at 85. Stochastic RSI signals overbought conditions at its upper extreme of 100. Bull/Bear Power (BBP) is positive at 0.0022, showing buyers dominate intraday momentum. Overbought readings suggest caution. Intraday volatility is at 7.12%. The session’s tone is strong as price holds up near the top of today’s range, although the contrast between bullish oscillators and bearish MACD highlights a degree of divergence in short-term signals.
Earlier, analysts noted that IOTA had shifted into a bullish short- and medium-term structure but remained constrained by longer-term resistance. The latest analysis builds on this view by highlighting ongoing short-term momentum alongside persistent divergence in technical signals, with a decisive move above $0.04 now emerging as the next critical level to monitor.





Latest IOTA News






-
 Afghanistan
-
 Albania
-
 Algeria
-
 Angola
-
 Argentina
-
 Armenia
-
 Australia
-
 Austria
-
 Azerbaijan
-
 Bahamas
-
 Bahrain
-
 Bangladesh
-
 Belarus
-
 Belgium
-
 Bolivia
-
 Botswana
-
 Brazil
-
 Brunei
-
 Bulgaria
-
 Cambodia
-
 Cameroon
-
 Canada
-
 Chile
Chile
-
 China
China
-
 Colombia
-
 Congo
Congo
-
 Costa Rica
-
 Cote d'Ivoire
-
 Croatia
-
 Cuba
Cuba
-
 Cyprus
-
 Czechia
-
 DR Congo
-
 Denmark
-
 Dominican Republic
-
 Ecuador
-
 Egypt
Egypt
-
 El Salvador
-
 Estonia
-
 Eswatini
-
 Ethiopia
-
 Finland
-
 France
-
 Georgia
-
 Germany
-
 Ghana
Ghana
-
 Greece
-
 Haiti
Haiti
-
 Hong Kong
-
 Hungary
-
 India
India
-
 Indonesia
-
 Iran, Islamic republic
-
 Iraq
Iraq
-
 Ireland
-
 Israel
-
 Italy
Italy
-
 Jamaica
-
 Japan
Japan
-
 Jordan
-
 Kazakhstan
-
 Kenya
Kenya
-
 Korea
Korea
-
 Kuwait
-
 Kyrgyzstan
-
 Laos
Laos
-
 Latvia
-
 Lebanon
-
 Lesotho
-
 Libya
Libya
-
 Lithuania
-
 Luxembourg
-
 Madagascar
-
 Malaysia
-
 Malta
Malta
-
 Mauritius
-
 Mexico
-
 Moldova
-
 Mongolia
-
 Montenegro
-
 Morocco
-
 Mozambique
-
 Myanmar
-
 Namibia
-
 Nepal
Nepal
-
 Netherlands
-
 New Zealand
-
 Nigeria
-
 North Macedonia
-
 Norway
-
 Oman
Oman
-
 Pakistan
-
 Palestine
-
 Panama
-
 Papua New Guinea
-
 Paraguay
-
 Peru
Peru
-
 Philippines
-
 Poland
-
 Portugal
-
 Puerto Rico
-
 Qatar
Qatar
-
 Reunion
-
 Romania
-
 Rwanda
-
 Saudi Arabia
-
 Serbia
-
 Singapore
-
 Slovakia
-
 Slovenia
-
 Somalia
-
 South Africa
-
 Spain
Spain
-
 Sri Lanka
-
 Sweden
-
 Switzerland
-
 Syria
Syria
-
 Taiwan
-
 Tajikistan
-
 Tanzania
-
 Thailand
-
 Trinidad and Tobago
-
 Tunisia
-
 Turkey
-
 UAE
UAE
-
 Uganda
-
 Ukraine
-
 United Kingdom
-
United States
-
 Uruguay
-
 Uzbekistan
-
 Venezuela
-
 Vietnam
-
 Yemen
Yemen
-
 Zambia
-
 Zimbabwe
- Forex
- Crypto












