

VeChain tests $0.00624686 resistance as Wanchain bridge and XFlows reactivation expands interoperability

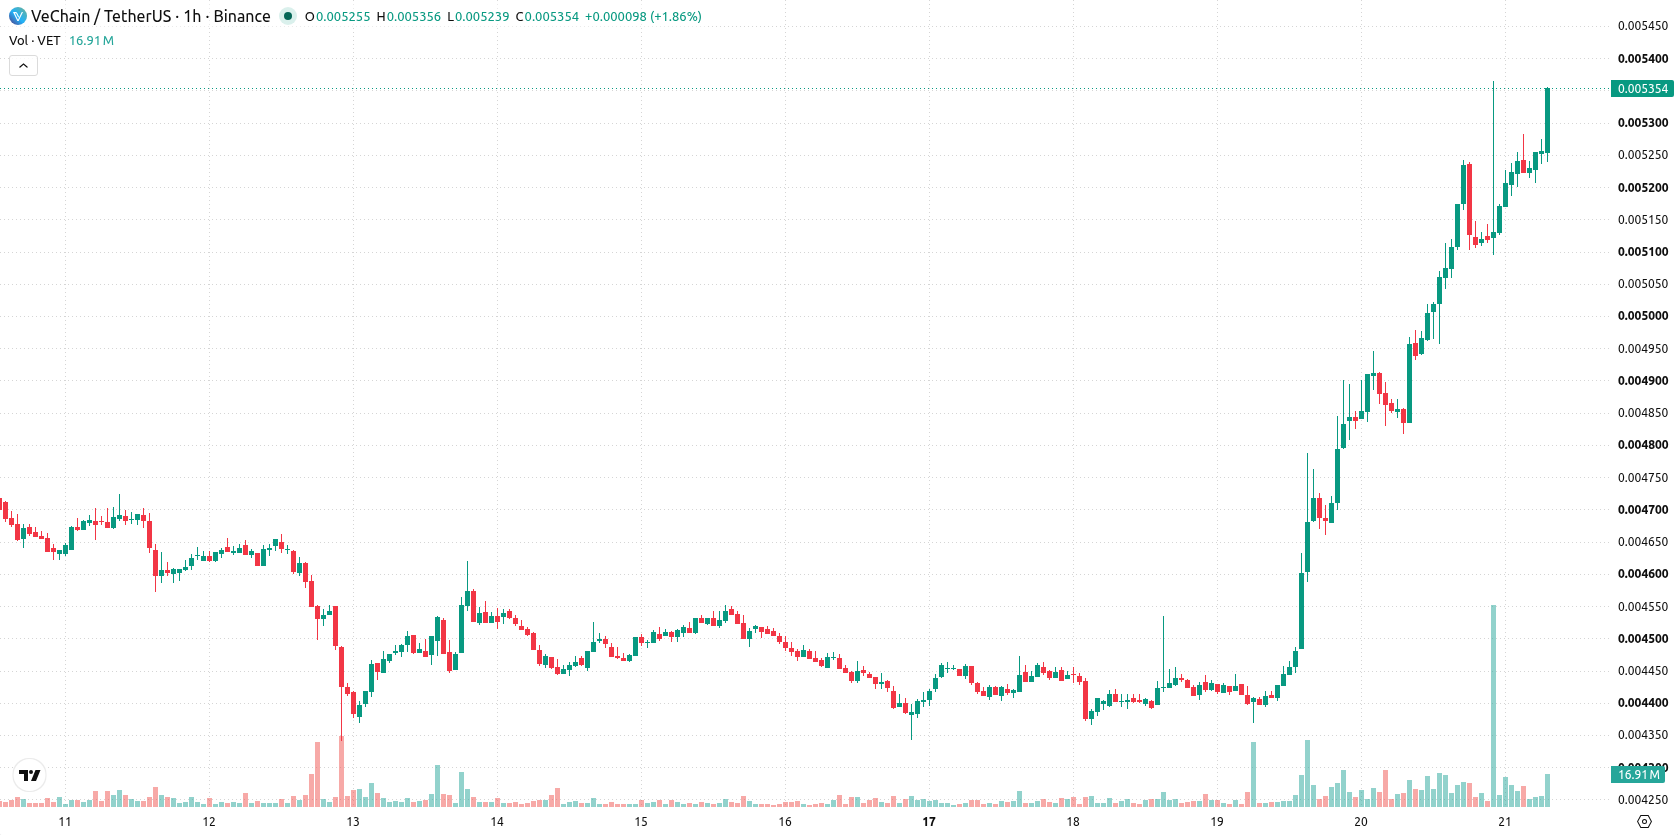
VeChain (VET) is trading at $0.005338, marking a daily gain of 10.61%. The asset sits above its key moving averages on the H1 timeframe, signifying ongoing short- and medium-term momentum.
 0.007454
0.00810000
0.007454
0.00810000
Highlights
- VeChain activated the Wanchain bridge and XFlows routes on August 13, enabling direct asset transfers with other blockchains.
- This technical upgrade expanded network connectivity and use cases, driving heightened transaction activity and demand for VET.
- VET/USD surged 10.61% and is projected to range between $0.00510947 and $0.00556653 over the next 2 to 3 days, with strong buy signals from momentum indicators and overbought oscillator conditions.
Surge accelerates as bridge reactivation boosts cross-chain demand
VeChain’s recent surge is primarily driven by the confirmed reactivation of the Wanchain bridge and XFlows routes on August 13, according to Diariobitcoin. This technical milestone significantly enhances interoperability, allowing direct asset transfers between VeChain and other blockchains. By broadening network connectivity and facilitating greater transactional utility, this development has encouraged active participation and supported increased demand for VET. The strengthened technical foundation is viewed as a core factor behind the current positive market sentiment.
Bullish momentum holds above support, but overbought risks rise
On the technical front, VET/USD is trading above its MA-20 and MA-50 on the H1 chart while remaining below the MA-200 resistance currently set at $0.00624686. The Ichimoku Kijun at $0.005091 serves as immediate support. Momentum indicators are decisively strong, with both MACD and ADX in Strong Buy territory, and intraday performance aligns with this bullish momentum. However, oscillator signals are mixed: RSI stands at an overbought 75.80, CCI also points to overbought conditions, while Stoch RSI is neutral and the Awesome Oscillator does not reinforce the uptrend. Bull/Bear Power signals continued buyer dominance despite moderate volatility.
Breakout odds strengthen as consolidation narrows near resistance
In the short term, VET/USD is expected to consolidate within the $0.00510947 to $0.00556653 range over the next 2–3 trading days. The probability of an upward breakout is very high, reflecting current momentum and technical strength. If resistance is surpassed, VET could extend its rally; if support near the Ichimoku Kijun breaks, a short-term retracement toward lower levels becomes possible, though this scenario is considered unlikely based on prevailing trend dynamics.
Earlier, analysts noted that VeChain’s technical outlook had shifted toward bullish potential following key network upgrades and enhanced interoperability. The latest market action reinforces this view, with short-term consolidation expected and attention focused on an imminent breakout above current resistance levels.










-
 Afghanistan
-
 Albania
-
 Algeria
-
 Angola
-
 Argentina
-
 Armenia
-
 Australia
-
 Austria
-
 Azerbaijan
-
 Bahamas
-
 Bahrain
-
 Bangladesh
-
 Belarus
-
 Belgium
-
 Bolivia
-
 Botswana
-
 Brazil
-
 Brunei
-
 Bulgaria
-
 Cambodia
-
 Cameroon
-
 Canada
-
 Chile
Chile
-
 China
China
-
 Colombia
-
 Congo
Congo
-
 Costa Rica
-
 Cote d'Ivoire
-
 Croatia
-
 Cuba
Cuba
-
 Cyprus
-
 Czechia
-
 DR Congo
-
 Denmark
-
 Dominican Republic
-
 Ecuador
-
 Egypt
Egypt
-
 El Salvador
-
 Estonia
-
 Eswatini
-
 Ethiopia
-
 Finland
-
 France
-
 Georgia
-
 Germany
-
 Ghana
Ghana
-
 Greece
-
 Haiti
Haiti
-
 Hong Kong
-
 Hungary
-
 India
India
-
 Indonesia
-
 Iran, Islamic republic
-
 Iraq
Iraq
-
 Ireland
-
 Israel
-
 Italy
Italy
-
 Jamaica
-
 Japan
Japan
-
 Jordan
-
 Kazakhstan
-
 Kenya
Kenya
-
 Korea
Korea
-
 Kuwait
-
 Kyrgyzstan
-
 Laos
Laos
-
 Latvia
-
 Lebanon
-
 Lesotho
-
 Libya
Libya
-
 Lithuania
-
 Luxembourg
-
 Madagascar
-
 Malaysia
-
 Malta
Malta
-
 Mauritius
-
 Mexico
-
 Moldova
-
 Mongolia
-
 Montenegro
-
 Morocco
-
 Mozambique
-
 Myanmar
-
 Namibia
-
 Nepal
Nepal
-
 Netherlands
-
 New Zealand
-
 Nigeria
-
 North Macedonia
-
 Norway
-
 Oman
Oman
-
 Pakistan
-
 Palestine
-
 Panama
-
 Papua New Guinea
-
 Paraguay
-
 Peru
Peru
-
 Philippines
-
 Poland
-
 Portugal
-
 Puerto Rico
-
 Qatar
Qatar
-
 Reunion
-
 Romania
-
 Rwanda
-
 Saudi Arabia
-
 Serbia
-
 Singapore
-
 Slovakia
-
 Slovenia
-
 Somalia
-
 South Africa
-
 Spain
Spain
-
 Sri Lanka
-
 Sweden
-
 Switzerland
-
 Syria
Syria
-
 Taiwan
-
 Tajikistan
-
 Tanzania
-
 Thailand
-
 Trinidad and Tobago
-
 Tunisia
-
 Turkey
-
 UAE
UAE
-
 Uganda
-
 Ukraine
-
 United Kingdom
-
United States
-
 Uruguay
-
 Uzbekistan
-
 Venezuela
-
 Vietnam
-
 Yemen
Yemen
-
 Zambia
-
 Zimbabwe
- Forex
- Crypto












