

GALA climbs almost 24% as rally tests resistance at $0.002055

Gala (GALA) surged 23.75% in active trading, driven by strong technical momentum as the price climbed above both its 20-day and 50-day moving averages. The rally looks limited, with Gala still trading below its 200-day moving average and encountering overhead resistance near $0.002055.
 0.002258
0.00249600
0.002258
0.00249600
Highlights
- GALA/USD currently trades above short- and medium-term moving averages, but remains below its long-term average, indicating opposing trends.
- Short-term technical indicators are mixed, with overbought signals on some oscillators and prevailing selling pressure in momentum readings.
- Expected 5-day range is $0.001682 to $0.0021915, with a 64% probability of a downward move and key resistance at $0.002055.
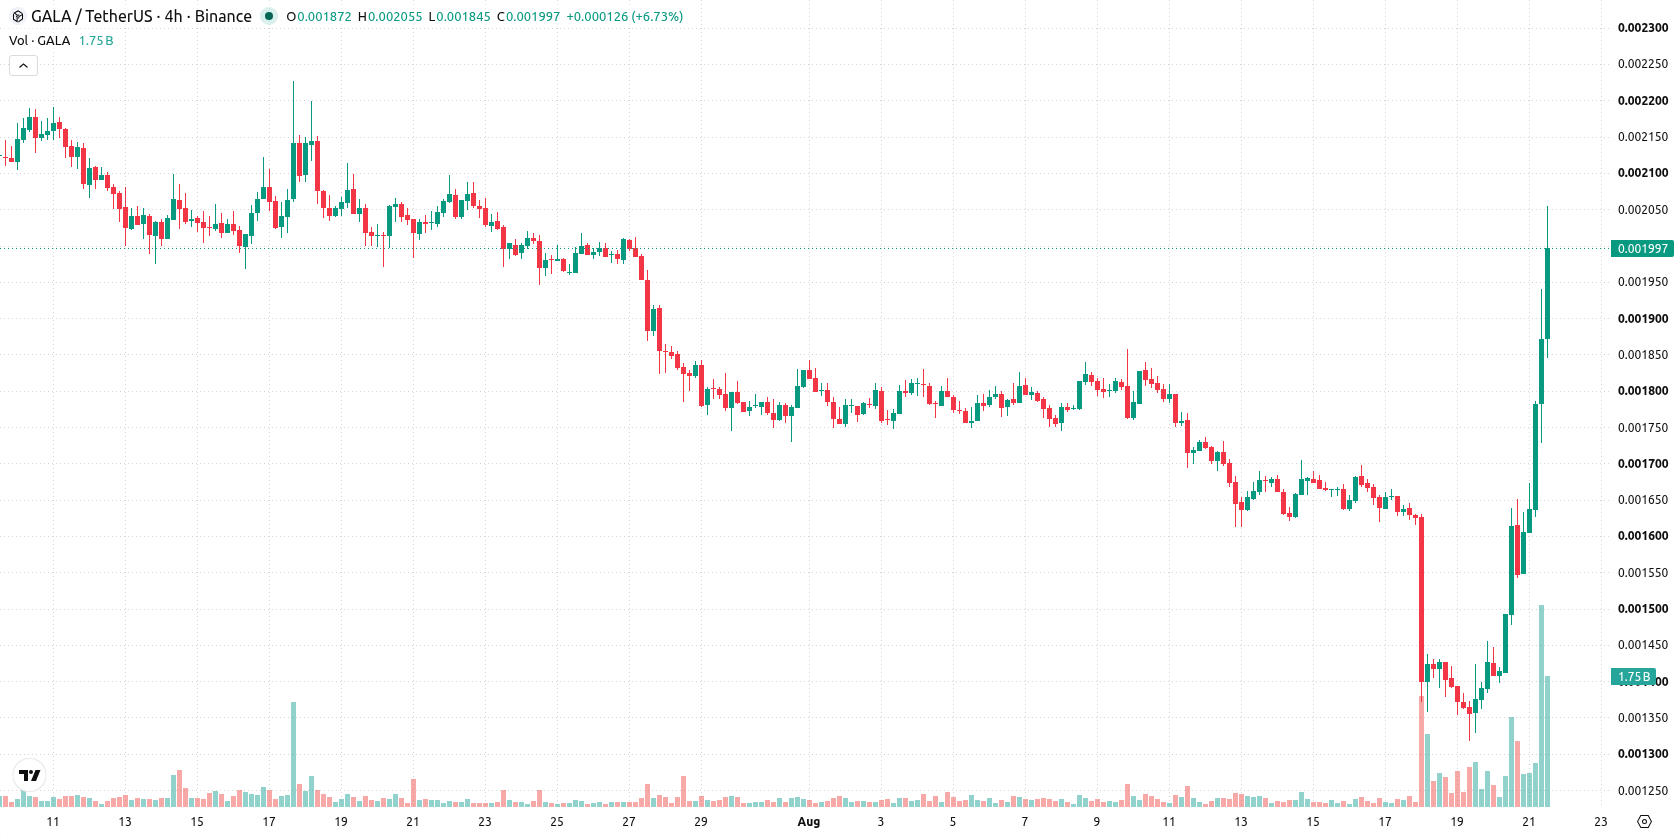
Mixed momentum signals persist as price nears resistance zone
GALA/USD currently trades above the 20-day and 50-day moving averages at $0.0016963 and $0.00191958, respectively, but remains below the 200-day moving average at $0.00293303. This pattern signals short- and medium-term bullish momentum amid a longer-term bearish trend, with immediate resistance at $0.002055 and support at $0.00191958. Momentum indicators show a mixed picture: MACD and ADX highlight ongoing selling pressure, the RSI reads neutral at 40, while the CCI indicates oversold conditions. The Stochastic RSI flags overbought conditions at 100, BBP remains positive, and the AO does not confirm a reversal. Gala is up $0.000384, or 23.75% today, nearing the session high with intraday volatility at 27.96%. Price action is strong near the upper end of the daily range, but underlying signals diverge.
Earlier, analysts noted that Gala was showing signs of short-term bullish momentum despite prevailing longer-term bearish risks. The current analysis signals increased volatility and diverging technical indicators, with traders advised to monitor for a decisive move above $0.002055 or below $0.00191958 as the next key inflection points.











-
 Afghanistan
-
 Albania
-
 Algeria
-
 Angola
-
 Argentina
-
 Armenia
-
 Australia
-
 Austria
-
 Azerbaijan
-
 Bahamas
-
 Bahrain
-
 Bangladesh
-
 Belarus
-
 Belgium
-
 Bolivia
-
 Botswana
-
 Brazil
-
 Brunei
-
 Bulgaria
-
 Cambodia
-
 Cameroon
-
 Canada
-
 Chile
Chile
-
 China
China
-
 Colombia
-
 Congo
Congo
-
 Costa Rica
-
 Cote d'Ivoire
-
 Croatia
-
 Cuba
Cuba
-
 Cyprus
-
 Czechia
-
 DR Congo
-
 Denmark
-
 Dominican Republic
-
 Ecuador
-
 Egypt
Egypt
-
 El Salvador
-
 Estonia
-
 Eswatini
-
 Ethiopia
-
 Finland
-
 France
-
 Georgia
-
 Germany
-
 Ghana
Ghana
-
 Greece
-
 Haiti
Haiti
-
 Hong Kong
-
 Hungary
-
 India
India
-
 Indonesia
-
 Iran, Islamic republic
-
 Iraq
Iraq
-
 Ireland
-
 Israel
-
 Italy
Italy
-
 Jamaica
-
 Japan
Japan
-
 Jordan
-
 Kazakhstan
-
 Kenya
Kenya
-
 Korea
Korea
-
 Kuwait
-
 Kyrgyzstan
-
 Laos
Laos
-
 Latvia
-
 Lebanon
-
 Lesotho
-
 Libya
Libya
-
 Lithuania
-
 Luxembourg
-
 Madagascar
-
 Malaysia
-
 Malta
Malta
-
 Mauritius
-
 Mexico
-
 Moldova
-
 Mongolia
-
 Montenegro
-
 Morocco
-
 Mozambique
-
 Myanmar
-
 Namibia
-
 Nepal
Nepal
-
 Netherlands
-
 New Zealand
-
 Nigeria
-
 North Macedonia
-
 Norway
-
 Oman
Oman
-
 Pakistan
-
 Palestine
-
 Panama
-
 Papua New Guinea
-
 Paraguay
-
 Peru
Peru
-
 Philippines
-
 Poland
-
 Portugal
-
 Puerto Rico
-
 Qatar
Qatar
-
 Reunion
-
 Romania
-
 Rwanda
-
 Saudi Arabia
-
 Serbia
-
 Singapore
-
 Slovakia
-
 Slovenia
-
 Somalia
-
 South Africa
-
 Spain
Spain
-
 Sri Lanka
-
 Sweden
-
 Switzerland
-
 Syria
Syria
-
 Taiwan
-
 Tajikistan
-
 Tanzania
-
 Thailand
-
 Trinidad and Tobago
-
 Tunisia
-
 Turkey
-
 UAE
UAE
-
 Uganda
-
 Ukraine
-
 United Kingdom
-
United States
-
 Uruguay
-
 Uzbekistan
-
 Venezuela
-
 Vietnam
-
 Yemen
Yemen
-
 Zambia
-
 Zimbabwe
- Forex
- Crypto












