

XRP ETF inflows fuel rally as recovery holds but faces a stretched setup: weekly outlook

ETFs have become a major force for XRP, with the digital asset climbing near $1.43 after a week that saw inflows surge by more than 40%. Strong institutional demand and recent developments on the XRP Ledger set a bullish tone, but stretched technical signals point to a market that may be vulnerable if flows slow or profit-taking begins in the coming week.
 1.3824
1.4996
1.3824
1.4996
Highlights
- XRP trades at $1.4325, posting a $0.4293 gain over the past week with strong upside momentum.
- The asset is in a strong short-term uptrend with high volatility and overbought technical readings.
- Predicted 7-day range is $1.146 to $1.719, with key support at $1.343 and resistance at $1.6999.
Institutional demand and regulatory clarity boost xrp inflows this week
In the past week, XRP recorded substantial inflows into U.S. spot XRP ETFs, with Yahoo Finance and CryptoTimes reporting over $40 million in net inflows and a cumulative total above $1.5 billion, underscoring rising institutional demand. Goldman Sachs disclosed $86.5 million in holdings across five spot XRP ETFs as of June 30, as highlighted by Yahoo Finance. Upgrades to the XRP Ledger 3.3.0 continued, with Ripple supporting the Permission Delegation amendment, while Ripple, Clearpool, and Cicada Partners worked towards launching institutional lending protocols onchain. Additional regulatory clarity arrived as the SEC and CFTC jointly categorized XRP as a digital commodity, according to The Motley Fool.
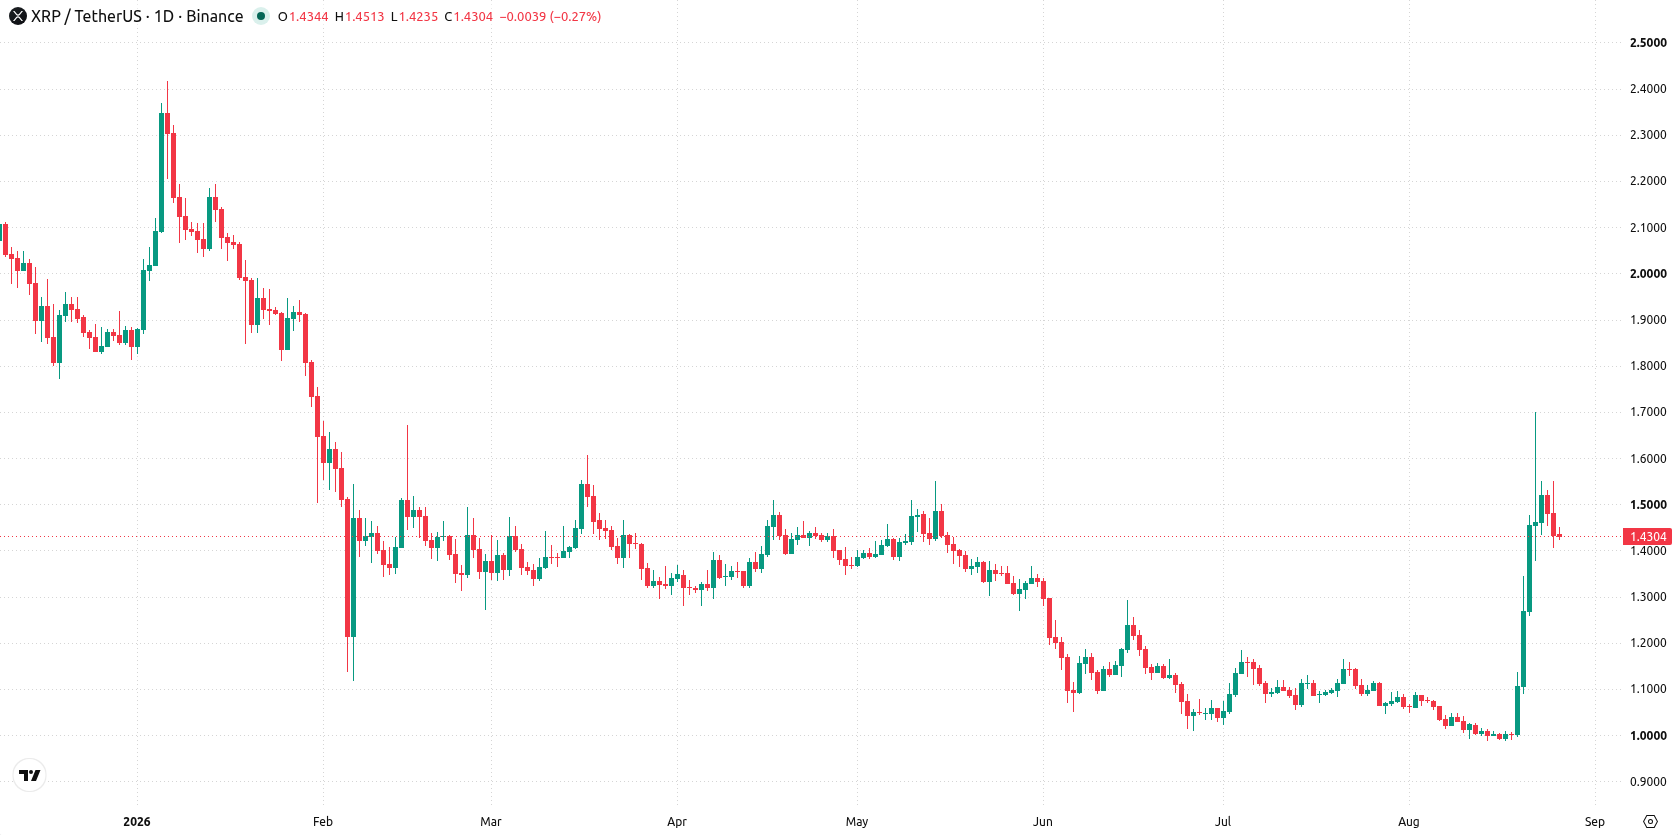
Persistent uptrend and overbought signals mark weekly technical picture
The daily chart shows XRP in a strong uptrend, supported by a sustained move higher with a firm trend and 56.26% volatility over the past week. RSI sits at 80.035 and CCI at 131.3234, both in the overbought zone, suggesting the advance has become stretched but remains persistent. The closest support is the Ichimoku Kijun at $1.343, while resistance is set by the recent weekly high at $1.6999. Despite stretched momentum readings, strength in MACD and Bull/Bear Power supports continued buying pressure unless support decisively fails.
Upside breakout risk as xrp eyes support-resistance wedge next week
Over the next 7 days, XRP is expected to trade between $1.146 and $1.719, with a very high probability of price increase and a very low probability of a decrease. The base case sees the price holding between support at $1.343 and resistance at $1.6999. A breakout above $1.6999 could trigger further upside, whereas a drop below $1.343 would indicate a potential retracement toward the lower end of the expected range.
Earlier, analysts noted that XRP was consolidating within a defined range amid a mix of institutional inflows and heightened network activity, but with prevailing downside momentum and oversold technical signals. With the recent surge in ETF inflows and technical overextension, traders should monitor for a potential breakout above $1.6999 or a retracement below $1.343 as key triggers for volatility in the coming week.





Latest XRP News






-
 Afghanistan
-
 Albania
-
 Algeria
-
 Angola
-
 Argentina
-
 Armenia
-
 Australia
-
 Austria
-
 Azerbaijan
-
 Bahamas
-
 Bahrain
-
 Bangladesh
-
 Belarus
-
 Belgium
-
 Bolivia
-
 Botswana
-
 Brazil
-
 Brunei
-
 Bulgaria
-
 Cambodia
-
 Cameroon
-
 Canada
-
 Chile
Chile
-
 China
China
-
 Colombia
-
 Congo
Congo
-
 Costa Rica
-
 Cote d'Ivoire
-
 Croatia
-
 Cuba
Cuba
-
 Cyprus
-
 Czechia
-
 DR Congo
-
 Denmark
-
 Dominican Republic
-
 Ecuador
-
 Egypt
Egypt
-
 El Salvador
-
 Estonia
-
 Eswatini
-
 Ethiopia
-
 Finland
-
 France
-
 Georgia
-
 Germany
-
 Ghana
Ghana
-
 Greece
-
 Haiti
Haiti
-
 Hong Kong
-
 Hungary
-
 India
India
-
 Indonesia
-
 Iran, Islamic republic
-
 Iraq
Iraq
-
 Ireland
-
 Israel
-
 Italy
Italy
-
 Jamaica
-
 Japan
Japan
-
 Jordan
-
 Kazakhstan
-
 Kenya
Kenya
-
 Korea
Korea
-
 Kuwait
-
 Kyrgyzstan
-
 Laos
Laos
-
 Latvia
-
 Lebanon
-
 Lesotho
-
 Libya
Libya
-
 Lithuania
-
 Luxembourg
-
 Madagascar
-
 Malaysia
-
 Malta
Malta
-
 Mauritius
-
 Mexico
-
 Moldova
-
 Mongolia
-
 Montenegro
-
 Morocco
-
 Mozambique
-
 Myanmar
-
 Namibia
-
 Nepal
Nepal
-
 Netherlands
-
 New Zealand
-
 Nigeria
-
 North Macedonia
-
 Norway
-
 Oman
Oman
-
 Pakistan
-
 Palestine
-
 Panama
-
 Papua New Guinea
-
 Paraguay
-
 Peru
Peru
-
 Philippines
-
 Poland
-
 Portugal
-
 Puerto Rico
-
 Qatar
Qatar
-
 Reunion
-
 Romania
-
 Rwanda
-
 Saudi Arabia
-
 Serbia
-
 Singapore
-
 Slovakia
-
 Slovenia
-
 Somalia
-
 South Africa
-
 Spain
Spain
-
 Sri Lanka
-
 Sweden
-
 Switzerland
-
 Syria
Syria
-
 Taiwan
-
 Tajikistan
-
 Tanzania
-
 Thailand
-
 Trinidad and Tobago
-
 Tunisia
-
 Turkey
-
 UAE
UAE
-
 Uganda
-
 Ukraine
-
 United Kingdom
-
United States
-
 Uruguay
-
 Uzbekistan
-
 Venezuela
-
 Vietnam
-
 Yemen
Yemen
-
 Zambia
-
 Zimbabwe
- Forex
- Crypto












