

Rally tests $0.007628 resistance: Can VET break higher in the VeChain weekly outlook?

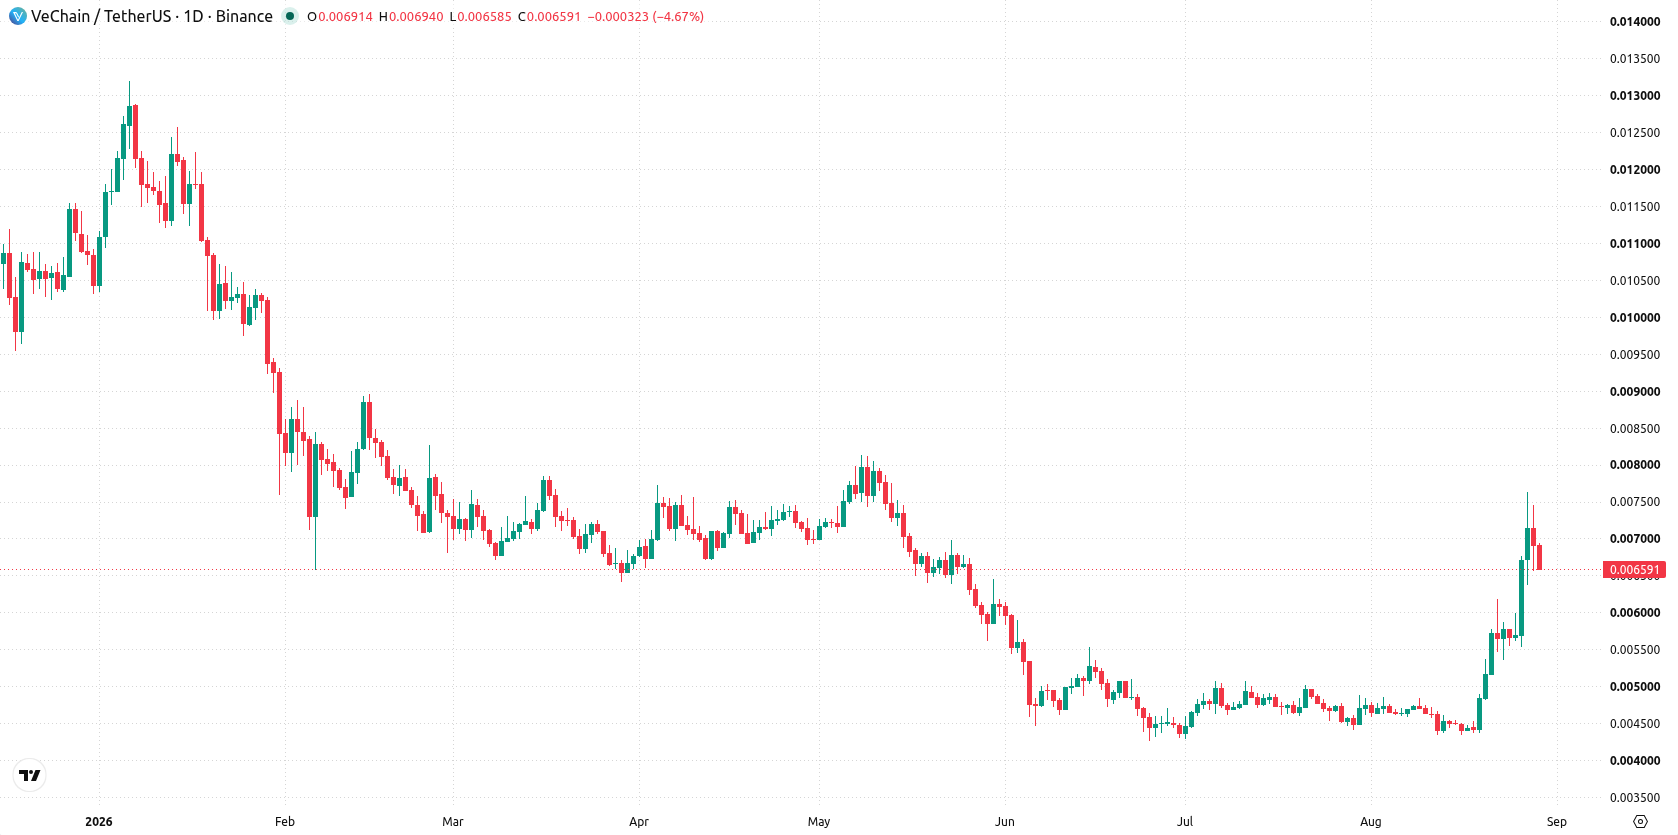
VeChain (VET) rallied to near $0.0067 this week, posting a gain of more than 13% as institutional interest fueled renewed momentum. The surge was driven by a wave of fresh buying and increased activity, putting the spotlight on overbought technical conditions and setting up a closely watched test of strength heading into the new week.
 0.007454
0.00810000
0.007454
0.00810000
Highlights
- VeChain gained 13.13% over the past week, trading at $0.006667 with positive short-term price momentum.
- Technical signals show a bullish daily trend and strong buying momentum, but overbought indicators may limit further gains in the near term.
- VeChain is expected to trade between $0.00546424 and $0.00786975 in the coming week, with key resistance at $0.007628 and support at $0.00616728.
network gains and upgrade news boost sentiment after downtrend reversal
VeChain saw a strong uptick in network activity after breaking out from its previous downtrend, with sources such as CaptainAltcoin, Coinpedia, and CryptoNews.net highlighting institutional flows and high trading volumes. Supporting sentiment, Coingabbar.com pointed to the project’s solid foundation, noting over 15 million known addresses and nearly 1,800 X-Nodes underpinning the ecosystem. TronWeekly.com also reported the ongoing development of VeChain’s forthcoming Interstellar upgrade, introducing key Ethereum compatibility, which serves as an additional long-term catalyst.
overbought signals emerge as weekly volatility and momentum surge
On the daily chart, the move higher comes with a volatility reading of 42.45%, highlighting the impact of strong swings during the week. Momentum is robust, as seen in the MACD and Bull/Bear Power, both pointing to buyer dominance, though RSI at 73.75 and CCI in overbought territory warn of stretched conditions. Nearest support sits at the 200-day average of $0.00616728, with the next resistance at the recent high of $0.007628. The current picture reflects a sustained move higher with a firm trend, but overbought readings suggest risk of a short-term pullback.
bullish bias with breakout risk as range holds for next week
In the week ahead, VeChain is expected to trade between $0.00546424 and $0.00786975. There is a 79% probability of an increase and a 21% chance of a decrease. The base case is continued trade inside this range, with strong upside if price clears resistance at $0.007628, while a drop below $0.00616728 could bring deeper retracement toward weekly lows.
Earlier, analysts noted that VeChain was maintaining bullish momentum while signaling caution due to overbought conditions and potential for near-term volatility. The current analysis reinforces the upside trend amid strong institutional interest and network activity, and traders should monitor the $0.007628 resistance as a pivotal breakout level in the days ahead.










-
 Afghanistan
-
 Albania
-
 Algeria
-
 Angola
-
 Argentina
-
 Armenia
-
 Australia
-
 Austria
-
 Azerbaijan
-
 Bahamas
-
 Bahrain
-
 Bangladesh
-
 Belarus
-
 Belgium
-
 Bolivia
-
 Botswana
-
 Brazil
-
 Brunei
-
 Bulgaria
-
 Cambodia
-
 Cameroon
-
 Canada
-
 Chile
Chile
-
 China
China
-
 Colombia
-
 Congo
Congo
-
 Costa Rica
-
 Cote d'Ivoire
-
 Croatia
-
 Cuba
Cuba
-
 Cyprus
-
 Czechia
-
 DR Congo
-
 Denmark
-
 Dominican Republic
-
 Ecuador
-
 Egypt
Egypt
-
 El Salvador
-
 Estonia
-
 Eswatini
-
 Ethiopia
-
 Finland
-
 France
-
 Georgia
-
 Germany
-
 Ghana
Ghana
-
 Greece
-
 Haiti
Haiti
-
 Hong Kong
-
 Hungary
-
 India
India
-
 Indonesia
-
 Iran, Islamic republic
-
 Iraq
Iraq
-
 Ireland
-
 Israel
-
 Italy
Italy
-
 Jamaica
-
 Japan
Japan
-
 Jordan
-
 Kazakhstan
-
 Kenya
Kenya
-
 Korea
Korea
-
 Kuwait
-
 Kyrgyzstan
-
 Laos
Laos
-
 Latvia
-
 Lebanon
-
 Lesotho
-
 Libya
Libya
-
 Lithuania
-
 Luxembourg
-
 Madagascar
-
 Malaysia
-
 Malta
Malta
-
 Mauritius
-
 Mexico
-
 Moldova
-
 Mongolia
-
 Montenegro
-
 Morocco
-
 Mozambique
-
 Myanmar
-
 Namibia
-
 Nepal
Nepal
-
 Netherlands
-
 New Zealand
-
 Nigeria
-
 North Macedonia
-
 Norway
-
 Oman
Oman
-
 Pakistan
-
 Palestine
-
 Panama
-
 Papua New Guinea
-
 Paraguay
-
 Peru
Peru
-
 Philippines
-
 Poland
-
 Portugal
-
 Puerto Rico
-
 Qatar
Qatar
-
 Reunion
-
 Romania
-
 Rwanda
-
 Saudi Arabia
-
 Serbia
-
 Singapore
-
 Slovakia
-
 Slovenia
-
 Somalia
-
 South Africa
-
 Spain
Spain
-
 Sri Lanka
-
 Sweden
-
 Switzerland
-
 Syria
Syria
-
 Taiwan
-
 Tajikistan
-
 Tanzania
-
 Thailand
-
 Trinidad and Tobago
-
 Tunisia
-
 Turkey
-
 UAE
UAE
-
 Uganda
-
 Ukraine
-
 United Kingdom
-
United States
-
 Uruguay
-
 Uzbekistan
-
 Venezuela
-
 Vietnam
-
 Yemen
Yemen
-
 Zambia
-
 Zimbabwe
- Forex
- Crypto












