

Support test at $0.3864: Can JTO avoid deeper losses?

Jito (JTO) is trading at $0.4114 after falling 8.94% on the day, with persistent downward movement. The asset remains below its key moving averages, highlighting continued bearish pressure across short-, medium-, and long-term horizons.
 0.5464
0.5856
0.5464
0.5856
Highlights
- JTO/USD trades below key moving averages, indicating sustained seller pressure across short, medium, and long timeframes.
- Bearish momentum prevails as both MACD and ADX confirm downside strength, with most indicators supporting further weakness.
- JTO/USD is expected to consolidate between $0.3864 and $0.4322 over the next 2 to 3 days, with a high probability of continued decline.
Seller momentum confirmed as indicators reinforce resistance ceiling
JTO/USD is positioned beneath the 20-day moving average at $0.4278, the 50-day at $0.4402, and the 200-day at $0.4734. The Ichimoku Kijun sits at $0.4371, acting as immediate resistance. Key technical indicators reinforce ongoing seller dominance: both MACD and ADX illustrate sustained downside strength, while RSI at 33.9976 and CCI both indicate a Sell. Stochastic RSI reads Neutral, as does the Awesome Oscillator, and Bull/Bear Power confirms intraday selling pressure. The price gapped lower by $0.0304 from the previous close and remains near today's low amid moderate volatility, with negative momentum supported across all main signals.
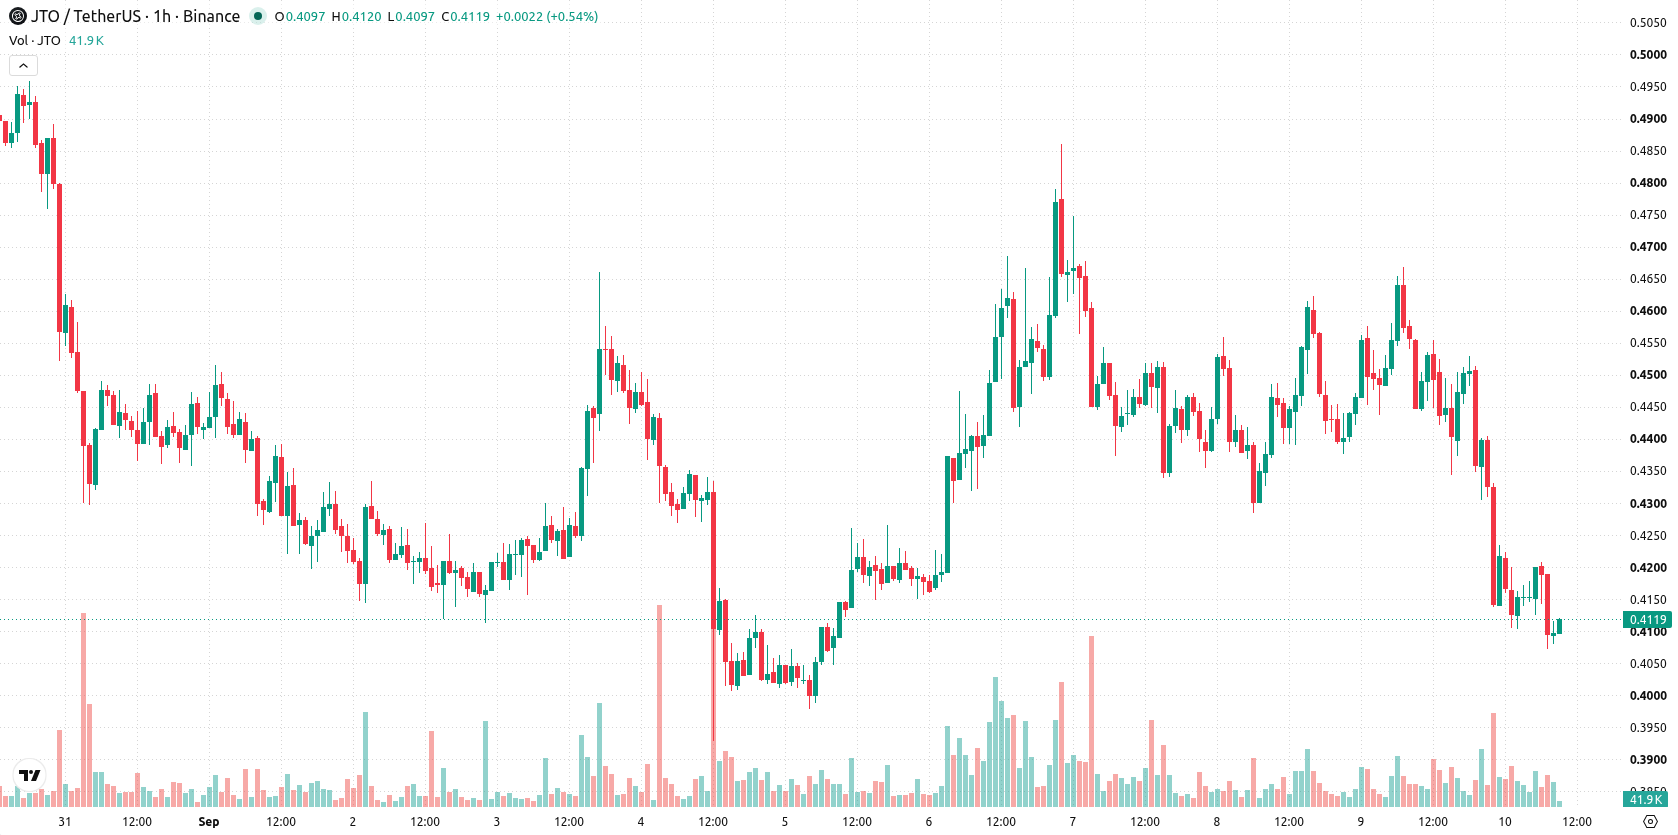
Downside risk elevated as upside breakout odds diminish
Over the next 2–3 trading days, JTO is expected to consolidate between $0.3864 and $0.4322, in line with its current volatility band. The probability of an upward breakout is considered very low, while the likelihood of downward movement remains high. For a bullish reversal scenario, a clear closing break above $0.4371 would be required, whereas a convincing close below support at $0.3864 would trigger further downside.
Previously it was reported that Jito was under sustained bearish pressure, with technical signals supporting a negative outlook. The latest analysis confirms this persistent weakness, highlighting the need to closely monitor price action around the $0.3864 support for any signs of further downside risk.










-
 Afghanistan
-
 Albania
-
 Algeria
-
 Angola
-
 Argentina
-
 Armenia
-
 Australia
-
 Austria
-
 Azerbaijan
-
 Bahamas
-
 Bahrain
-
 Bangladesh
-
 Belarus
-
 Belgium
-
 Bolivia
-
 Botswana
-
 Brazil
-
 Brunei
-
 Bulgaria
-
 Cambodia
-
 Cameroon
-
 Canada
-
 Chile
Chile
-
 China
China
-
 Colombia
-
 Congo
Congo
-
 Costa Rica
-
 Cote d'Ivoire
-
 Croatia
-
 Cuba
Cuba
-
 Cyprus
-
 Czechia
-
 DR Congo
-
 Denmark
-
 Dominican Republic
-
 Ecuador
-
 Egypt
Egypt
-
 El Salvador
-
 Estonia
-
 Eswatini
-
 Ethiopia
-
 Finland
-
 France
-
 Georgia
-
 Germany
-
 Ghana
Ghana
-
 Greece
-
 Haiti
Haiti
-
 Hong Kong
-
 Hungary
-
 India
India
-
 Indonesia
-
 Iran, Islamic republic
-
 Iraq
Iraq
-
 Ireland
-
 Israel
-
 Italy
Italy
-
 Jamaica
-
 Japan
Japan
-
 Jordan
-
 Kazakhstan
-
 Kenya
Kenya
-
 Korea
Korea
-
 Kuwait
-
 Kyrgyzstan
-
 Laos
Laos
-
 Latvia
-
 Lebanon
-
 Lesotho
-
 Libya
Libya
-
 Lithuania
-
 Luxembourg
-
 Madagascar
-
 Malaysia
-
 Malta
Malta
-
 Mauritius
-
 Mexico
-
 Moldova
-
 Mongolia
-
 Montenegro
-
 Morocco
-
 Mozambique
-
 Myanmar
-
 Namibia
-
 Nepal
Nepal
-
 Netherlands
-
 New Zealand
-
 Nigeria
-
 North Macedonia
-
 Norway
-
 Oman
Oman
-
 Pakistan
-
 Palestine
-
 Panama
-
 Papua New Guinea
-
 Paraguay
-
 Peru
Peru
-
 Philippines
-
 Poland
-
 Portugal
-
 Puerto Rico
-
 Qatar
Qatar
-
 Reunion
-
 Romania
-
 Rwanda
-
 Saudi Arabia
-
 Serbia
-
 Singapore
-
 Slovakia
-
 Slovenia
-
 Somalia
-
 South Africa
-
 Spain
Spain
-
 Sri Lanka
-
 Sweden
-
 Switzerland
-
 Syria
Syria
-
 Taiwan
-
 Tajikistan
-
 Tanzania
-
 Thailand
-
 Trinidad and Tobago
-
 Tunisia
-
 Turkey
-
 UAE
UAE
-
 Uganda
-
 Ukraine
-
 United Kingdom
-
United States
-
 Uruguay
-
 Uzbekistan
-
 Venezuela
-
 Vietnam
-
 Yemen
Yemen
-
 Zambia
-
 Zimbabwe
- Forex
- Crypto












