

Solana price support test: Key levels to watch

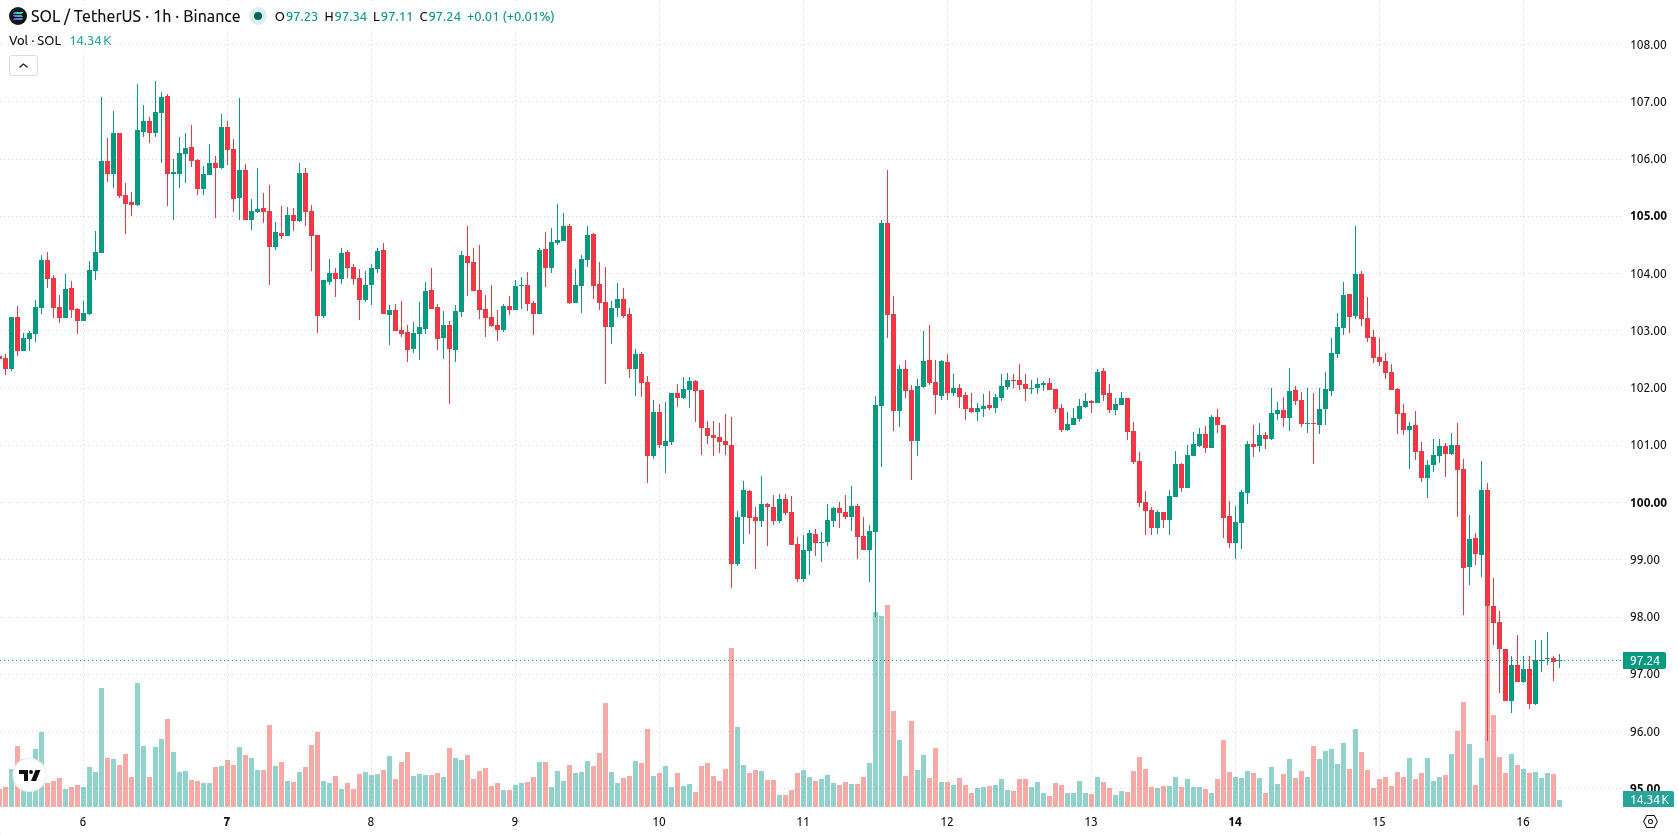
Solana (SOL) is trading at $97.19, down 4.15% on the day. The asset is positioned below its key short- and medium-term moving averages but remains above its longer-term averages.
 108.82
120.70
108.82
120.70
Highlights
- Solana activated the Transaction V1 upgrade on mainnet, expanding the maximum transaction size to 4,096 bytes.
- The update increases support for complex decentralized applications, including zero-knowledge proofs and advanced DeFi protocols.
- SOL trades under key short- and medium-term moving averages with momentum indicators negative and price seen consolidating in a $94.16 to $99.42 range.
Transaction format upgrade expands capabilities but fails to lift sentiment
On September 15, 2026, Solana activated its Transaction V1 format on the mainnet, increasing the maximum transaction size from 1,232 bytes to 4,096 bytes, according to Cointelegraph. This upgrade enables support for more complex and data-intensive decentralized applications, including zero-knowledge proofs, larger multisignature arrangements, and advanced DeFi protocols. While the development broadens the platform’s technical capabilities, it was not accompanied by a positive price response and comes amid prevailing downward momentum.
Multiple sell signals emerge as negative momentum deepens near support
On the hourly chart, SOL is trading below both the MA-20 and MA-50, indicating sustained intraday and short-term weakness. The MA-200 on the daily timeframe remains intact beneath current price levels, preserving longer-term structure. The immediate resistance is set by the Ichimoku Kijun at $98.77, while support stands near $94.16. Among the indicators, MACD signals a strong sell and ADX is on sell, confirming negative momentum. RSI, CCI, and Stochastic RSI have all entered oversold territory, highlighting persistent downside pressure. Bull/Bear Power shows clear control by sellers, and the Awesome Oscillator offers no clear directional bias.
High probability of range trading amid bearish short-term outlook
Over the short term, SOL is expected to consolidate in a range between $94.16 and $99.42. Scenario analysis gives a 76% probability to further downward movement, with only a 24% chance of a rebound. The baseline forecast anticipates price action remaining confined within this band unless a breakout above the $98.77 resistance triggers a bullish response. Should support at $94.16 fail, accelerated declines are likely to follow.
Earlier, analysts noted that Solana was under continued short-term selling pressure despite ongoing institutional accumulation and network upgrades. With current technical indicators signaling oversold conditions and downside momentum, traders should closely monitor the $94.16 support level, as a failure to hold could trigger further declines.





Latest Solana News





-
 Afghanistan
-
 Albania
-
 Algeria
-
 Angola
-
 Argentina
-
 Armenia
-
 Australia
-
 Austria
-
 Azerbaijan
-
 Bahamas
-
 Bahrain
-
 Bangladesh
-
 Belarus
-
 Belgium
-
 Bolivia
-
 Botswana
-
 Brazil
-
 Brunei
-
 Bulgaria
-
 Cambodia
-
 Cameroon
-
 Canada
-
 Chile
Chile
-
 China
China
-
 Colombia
-
 Congo
Congo
-
 Costa Rica
-
 Cote d'Ivoire
-
 Croatia
-
 Cuba
Cuba
-
 Cyprus
-
 Czechia
-
 DR Congo
-
 Denmark
-
 Dominican Republic
-
 Ecuador
-
 Egypt
Egypt
-
 El Salvador
-
 Estonia
-
 Eswatini
-
 Ethiopia
-
 Finland
-
 France
-
 Georgia
-
 Germany
-
 Ghana
Ghana
-
 Greece
-
 Haiti
Haiti
-
 Hong Kong
-
 Hungary
-
 India
India
-
 Indonesia
-
 Iran, Islamic republic
-
 Iraq
Iraq
-
 Ireland
-
 Israel
-
 Italy
Italy
-
 Jamaica
-
 Japan
Japan
-
 Jordan
-
 Kazakhstan
-
 Kenya
Kenya
-
 Korea
Korea
-
 Kuwait
-
 Kyrgyzstan
-
 Laos
Laos
-
 Latvia
-
 Lebanon
-
 Lesotho
-
 Libya
Libya
-
 Lithuania
-
 Luxembourg
-
 Madagascar
-
 Malaysia
-
 Malta
Malta
-
 Mauritius
-
 Mexico
-
 Moldova
-
 Mongolia
-
 Montenegro
-
 Morocco
-
 Mozambique
-
 Myanmar
-
 Namibia
-
 Nepal
Nepal
-
 Netherlands
-
 New Zealand
-
 Nigeria
-
 North Macedonia
-
 Norway
-
 Oman
Oman
-
 Pakistan
-
 Palestine
-
 Panama
-
 Papua New Guinea
-
 Paraguay
-
 Peru
Peru
-
 Philippines
-
 Poland
-
 Portugal
-
 Puerto Rico
-
 Qatar
Qatar
-
 Reunion
-
 Romania
-
 Rwanda
-
 Saudi Arabia
-
 Serbia
-
 Singapore
-
 Slovakia
-
 Slovenia
-
 Somalia
-
 South Africa
-
 Spain
Spain
-
 Sri Lanka
-
 Sweden
-
 Switzerland
-
 Syria
Syria
-
 Taiwan
-
 Tajikistan
-
 Tanzania
-
 Thailand
-
 Trinidad and Tobago
-
 Tunisia
-
 Turkey
-
 UAE
UAE
-
 Uganda
-
 Ukraine
-
 United Kingdom
-
United States
-
 Uruguay
-
 Uzbekistan
-
 Venezuela
-
 Vietnam
-
 Yemen
Yemen
-
 Zambia
-
 Zimbabwe
- Forex
- Crypto












