

Quant technical analysis: Downside risk rises with price nearing $174.96 support

Quant (QNT) is trading at $181.92, marking a daily decline of 7.29%. The asset is currently positioned below its key moving averages while remaining supported above its longer-term trend, and intraday volatility has been notable.
 205.54
213.06
Highlights
- Quant closed at $187.09, falling below the $200 level and nearing the October 18 low in a volatile session.
- Renewed downward momentum has pushed Quant beneath recent consolidation ranges, with selling pressure dominating trading activity.
- Technical analysis signals seller control, weak momentum, and projects a high probability of price moving between $174.96 to $188.88 in the near term.
Renewed selling pressure as momentum fades near support
Quant closed at $187.09 on October 22 after ranging between $185.50 and $208.78 for the session, reversing a previous close above the $200 level and approaching the October 18 low, according to Thecryptobasic. This retreat toward an earlier support level suggested renewed selling pressure and fading momentum among traders. The movement reinforced a cautious sentiment for participants in the near term as price action broke beneath recent consolidation bands.
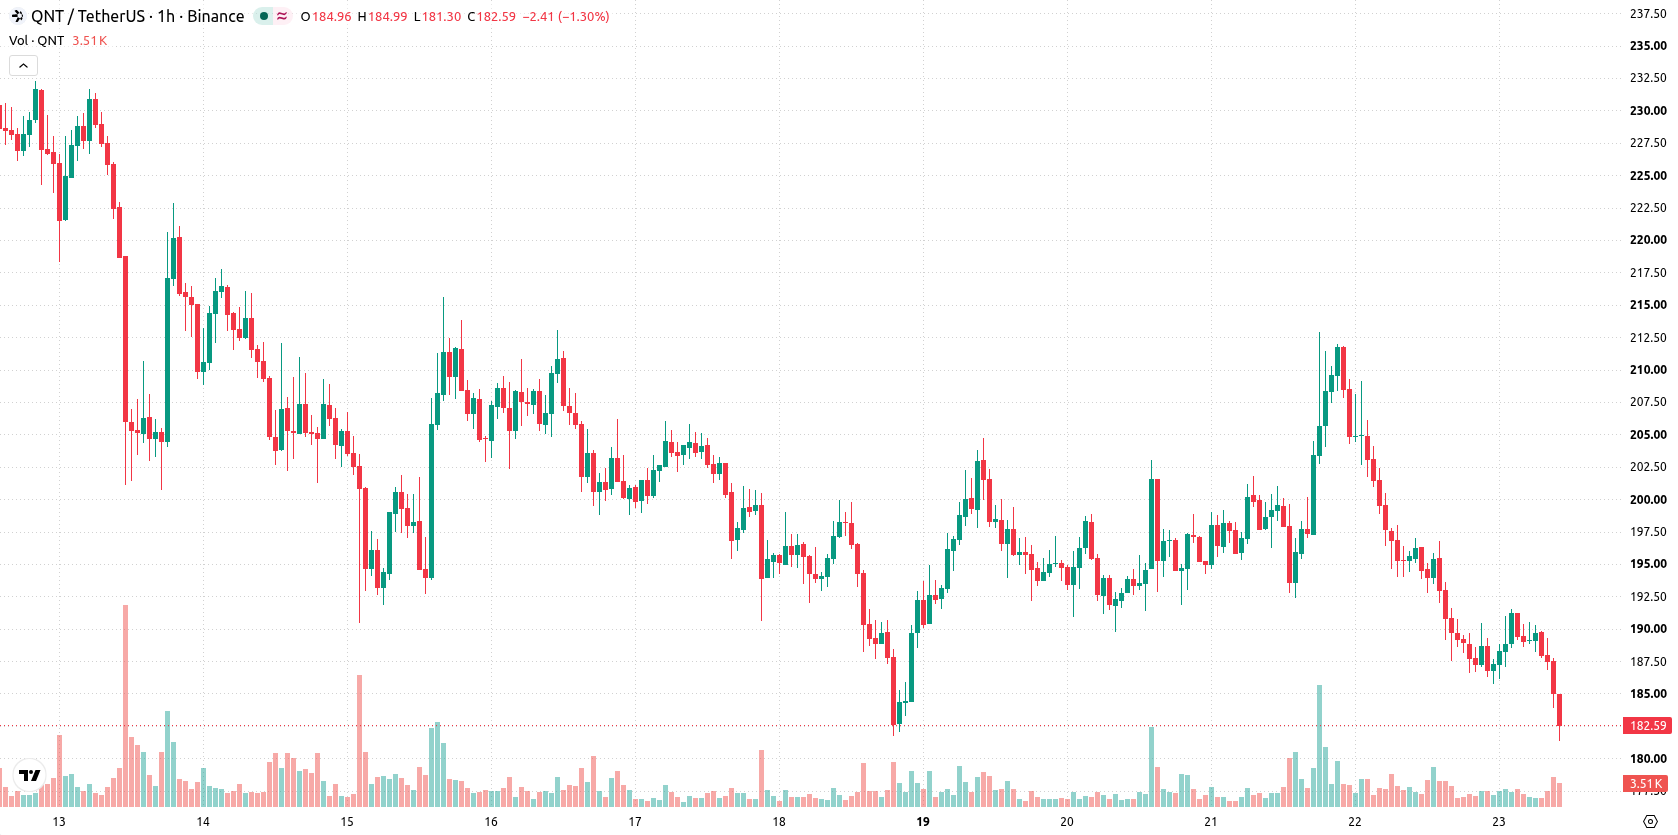
Bearish outlook as resistance holds and momentum weakens
On the hourly timeframe, QNT has slipped below both the MA-20 at $188.89 and the MA-50 at $195.64, with the daily MA-200 remaining lower at $89.70. Immediate resistance is defined by the Ichimoku Kijun at $191.35, while support is situated at $174.96. Momentum indicators are negative: MACD issues a strong sell, ADX a sell, and RSI reads 35.92, signaling a sell bias and proximity to oversold levels. CCI and Bull/Bear Power both indicate oversold conditions and continued seller dominance, while Stochastic RSI and the Awesome Oscillator remain neutral, reflecting brief pauses within prevailing negative momentum. No significant divergences are present, and the asset is trading close to intraday lows, confirming the bearish technical picture.
Downside risk elevated as price nears critical range floor
Over the short term, QNT is expected to trade between $174.96 and $188.88, reflecting a volatility band in line with recent movement. The probability of a sustained upward move remains very low, with downside risk notably elevated; bullish reversals are unlikely unless price can reclaim and break decisively above $191.35. The baseline scenario sees price consolidating within this range, while a bullish breakout above $191.35 could enable recovery, and a drop below $174.96 may lead to new short-term lows.
Earlier, analysts noted that Quant was entering a period of downside momentum and persistent uncertainty regarding its token demand outlook. The current analysis strengthens this view by highlighting pronounced bearish technical signals and elevated short-term downside risk, with $174.96 remaining a critical support level for traders to monitor going forward.











-
 Afghanistan
-
 Albania
-
 Algeria
-
 Angola
-
 Argentina
-
 Armenia
-
 Australia
-
 Austria
-
 Azerbaijan
-
 Bahamas
-
 Bahrain
-
 Bangladesh
-
 Belarus
-
 Belgium
-
 Bolivia
-
 Botswana
-
 Brazil
-
 Brunei
-
 Bulgaria
-
 Cambodia
-
 Cameroon
-
 Canada
-
 Chile
-
 China
-
 Colombia
-
 Congo
-
 Costa Rica
-
 Cote d'Ivoire
-
 Croatia
-
 Cuba
-
 Cyprus
-
 Czechia
-
 DR Congo
-
 Denmark
-
 Dominican Republic
-
 Ecuador
-
 Egypt
-
 El Salvador
-
 Estonia
-
 Eswatini
-
 Ethiopia
-
 Finland
-
 France
-
 Georgia
-
 Germany
-
 Ghana
-
 Greece
-
 Haiti
-
 Hong Kong
-
 Hungary
-
 India
-
 Indonesia
-
 Iran, Islamic republic
-
 Iraq
-
 Ireland
-
 Israel
-
 Italy
-
 Jamaica
-
 Japan
-
 Jordan
-
 Kazakhstan
-
 Kenya
-
 Korea
-
 Kuwait
-
 Kyrgyzstan
-
 Laos
-
 Latvia
-
 Lebanon
-
 Lesotho
-
 Libya
-
 Lithuania
-
 Luxembourg
-
 Madagascar
-
 Malaysia
-
 Malta
-
 Mauritius
-
 Mexico
-
 Moldova
-
 Mongolia
-
 Montenegro
-
 Morocco
-
 Mozambique
-
 Myanmar
-
 Namibia
-
 Nepal
-
 Netherlands
-
 New Zealand
-
 Nigeria
-
 North Macedonia
-
 Norway
-
 Oman
-
 Pakistan
-
 Palestine
-
 Panama
-
 Papua New Guinea
-
 Paraguay
-
 Peru
-
 Philippines
-
 Poland
-
 Portugal
-
 Puerto Rico
-
 Qatar
-
 Reunion
-
 Romania
-
 Rwanda
-
 Saudi Arabia
-
 Serbia
-
 Singapore
-
 Slovakia
-
 Slovenia
-
 Somalia
-
 South Africa
-
 Spain
-
 Sri Lanka
-
 Sweden
-
 Switzerland
-
 Syria
-
 Taiwan
-
 Tajikistan
-
 Tanzania
-
 Thailand
-
 Trinidad and Tobago
-
 Tunisia
-
 Turkey
-
 UAE
-
 Uganda
-
 Ukraine
-
 United Kingdom
-
United States
-
 Uruguay
-
 Uzbekistan
-
 Venezuela
-
 Vietnam
-
 Yemen
-
 Zambia
-
 Zimbabwe
- Forex
- Crypto












