
+2.27% for AstraZeneca stock — ongoing buyer dominance and bullish MACD signal

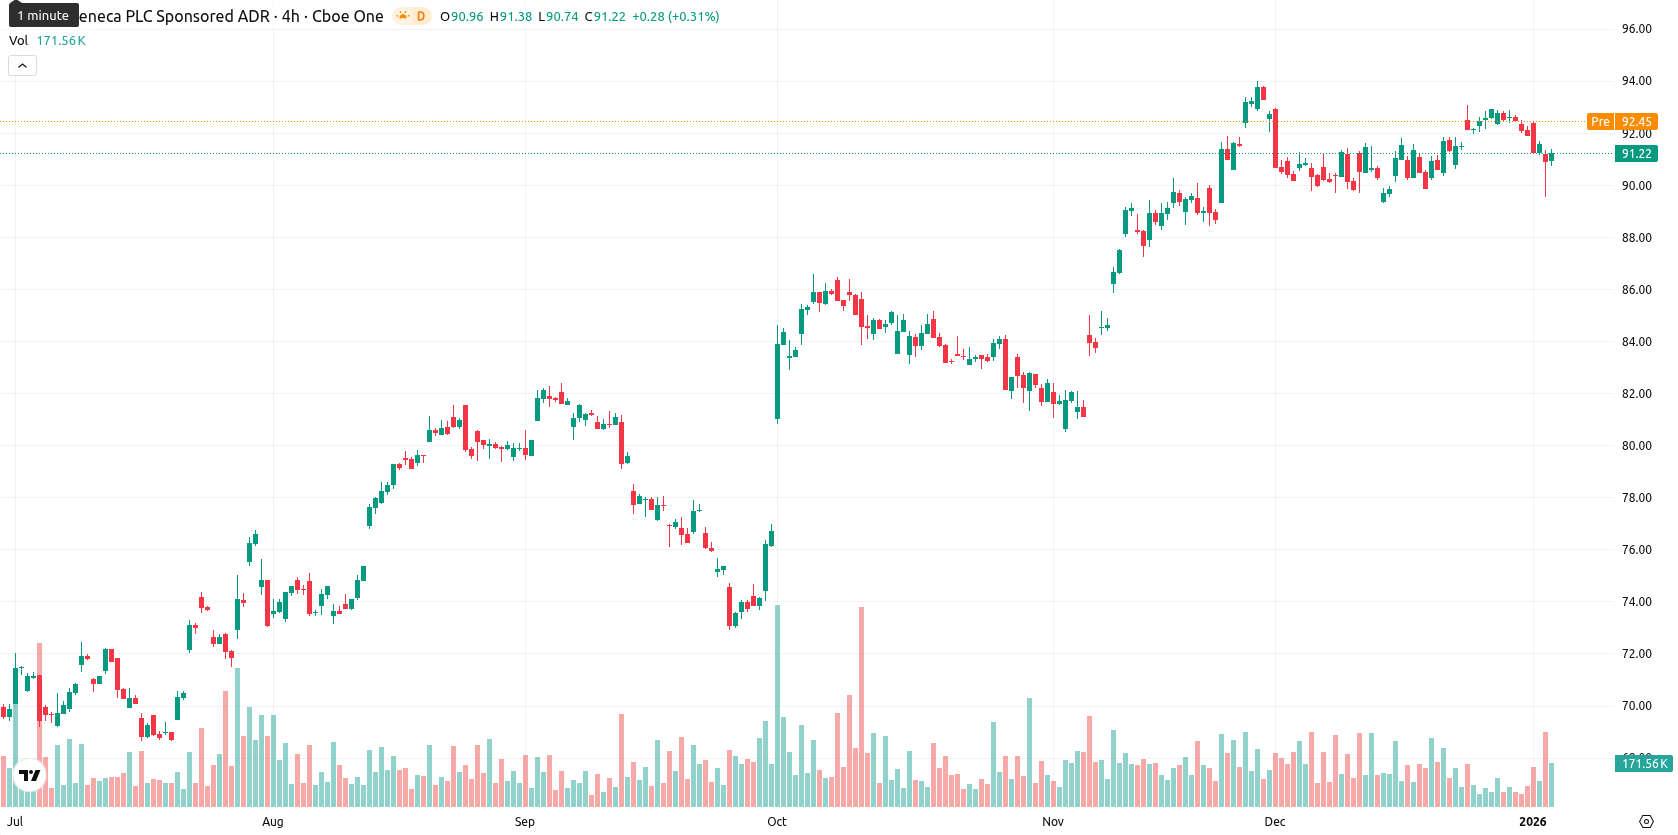
AstraZeneca PLC (AZN) is trading at GBX 13,688.00, up from the previous close after opening with a small upward gap. The price is currently above both its MA-20 (GBX 13,603.10) and MA-50 (GBX 13,391.04), while remaining well above the MA-200 (GBX 11,647.01), confirming a sustained positive trend.
Highlights
- AstraZeneca reported positive Phase 3 trial results for subcutaneous anifrolumab in systemic lupus erythematosus, advancing its drug pipeline.
- Allspring Global Investments Holdings LLC increased its stake in AstraZeneca PLC by 10.1% during the third quarter, reflecting growing institutional interest.
- AstraZeneca remains recognized as a stable, dividend-paying large-cap healthcare stock, reinforcing its appeal to income-focused investors.
Pipeline progress and stake increases buoy sentiment amid trial success
AstraZeneca reported positive results from a Phase 3 clinical trial evaluating the subcutaneous administration of anifrolumab for systemic lupus erythematosus, marking a significant step in advancing its pipeline. Additionally, Allspring Global Investments Holdings LLC increased its stake in AstraZeneca PLC by 10.1% during the third quarter. The company continues to be recognized as a stable, dividend-paying large-cap healthcare stock.
Mixed momentum signals as resistance looms and buyers persist
The technical outlook for AZN remains constructive, with the price holding above key moving averages (MA-20, MA-50, and MA-200) and the next dynamic resistance marked by the Kijun line at GBX 14,378.18, while MA-50 provides nearby support. Momentum signals are mixed: daily MACD displays a strong buy and ADX remains elevated, highlighting robust bullish momentum; however, RSI is neutral and both Stoch RSI and CCI indicate oversold conditions, while BBP points to buyer dominance and the Awesome Oscillator signals a strong sell divergence. AZN started the session with a modest upward gap and is now trading near its intraday high with moderate volatility, reflecting ongoing upward pressure from buyers.
Sideways consolidation likely as high breakout risk coexists with support
In the short term, AZN is expected to trade within a GBX 13,400 to GBX 14,100 volatility band relative to current levels, consistent with typical weekly movements. There is a high probability (above 80%) of continued upside, supported by bullish readings from the weekly MACD, MA-50, ADX, and RSI, while the risk of a downside reversal remains modest. The baseline scenario anticipates sideways consolidation between the MA-50 support and the Kijun resistance. A bullish breakout above the Kijun line may pave the way for new highs, while a drop below the MA-50 could lead to a short-term correction toward the lower end of the range.
Last time, analysts noted that AstraZeneca PLC is experiencing short-term pressure as it trades below the 20-day moving average but remains in a bullish medium- and long-term trend above the 50-day and 200-day averages. Technical indicators such as a strong MACD and ADX support continued buying momentum, with consolidation expected near key support and resistance levels before any potential breakout.


Latest AstraZeneca News


-
 Afghanistan
-
 Albania
-
 Algeria
-
 Angola
-
 Argentina
-
 Armenia
-
 Australia
-
 Austria
-
 Azerbaijan
-
 Bahamas
-
 Bahrain
-
 Bangladesh
-
 Belarus
-
 Belgium
-
 Bolivia
-
 Botswana
-
 Brazil
-
 Brunei
-
 Bulgaria
-
 Cambodia
-
 Cameroon
-
 Canada
-
 Chile
Chile
-
 China
China
-
 Colombia
-
 Congo
Congo
-
 Costa Rica
-
 Cote d'Ivoire
-
 Croatia
-
 Cuba
Cuba
-
 Cyprus
-
 Czechia
-
 DR Congo
-
 Denmark
-
 Dominican Republic
-
 Ecuador
-
 Egypt
Egypt
-
 El Salvador
-
 Estonia
-
 Eswatini
-
 Ethiopia
-
 Finland
-
 France
-
 Georgia
-
 Germany
-
 Ghana
Ghana
-
 Greece
-
 Haiti
Haiti
-
 Hong Kong
-
 Hungary
-
 India
India
-
 Indonesia
-
 Iran, Islamic republic
-
 Iraq
Iraq
-
 Ireland
-
 Israel
-
 Italy
Italy
-
 Jamaica
-
 Japan
Japan
-
 Jordan
-
 Kazakhstan
-
 Kenya
Kenya
-
 Korea
Korea
-
 Kuwait
-
 Kyrgyzstan
-
 Laos
Laos
-
 Latvia
-
 Lebanon
-
 Lesotho
-
 Libya
Libya
-
 Lithuania
-
 Luxembourg
-
 Madagascar
-
 Malaysia
-
 Malta
Malta
-
 Mauritius
-
 Mexico
-
 Moldova
-
 Mongolia
-
 Montenegro
-
 Morocco
-
 Mozambique
-
 Myanmar
-
 Namibia
-
 Nepal
Nepal
-
 Netherlands
-
 New Zealand
-
 Nigeria
-
 North Macedonia
-
 Norway
-
 Oman
Oman
-
 Pakistan
-
 Palestine
-
 Panama
-
 Papua New Guinea
-
 Paraguay
-
 Peru
Peru
-
 Philippines
-
 Poland
-
 Portugal
-
 Puerto Rico
-
 Qatar
Qatar
-
 Reunion
-
 Romania
-
 Rwanda
-
 Saudi Arabia
-
 Serbia
-
 Singapore
-
 Slovakia
-
 Slovenia
-
 Somalia
-
 South Africa
-
 Spain
Spain
-
 Sri Lanka
-
 Sweden
-
 Switzerland
-
 Syria
Syria
-
 Taiwan
-
 Tajikistan
-
 Tanzania
-
 Thailand
-
 Trinidad and Tobago
-
 Tunisia
-
 Turkey
-
 UAE
UAE
-
 Uganda
-
 Ukraine
-
 United Kingdom
-
United States
-
 Uruguay
-
 Uzbekistan
-
 Venezuela
-
 Vietnam
-
 Yemen
Yemen
-
 Zambia
-
 Zimbabwe
- Forex
- Crypto
