
AstraZeneca stock: Technical strength and robust EPS drive 1.33% advance

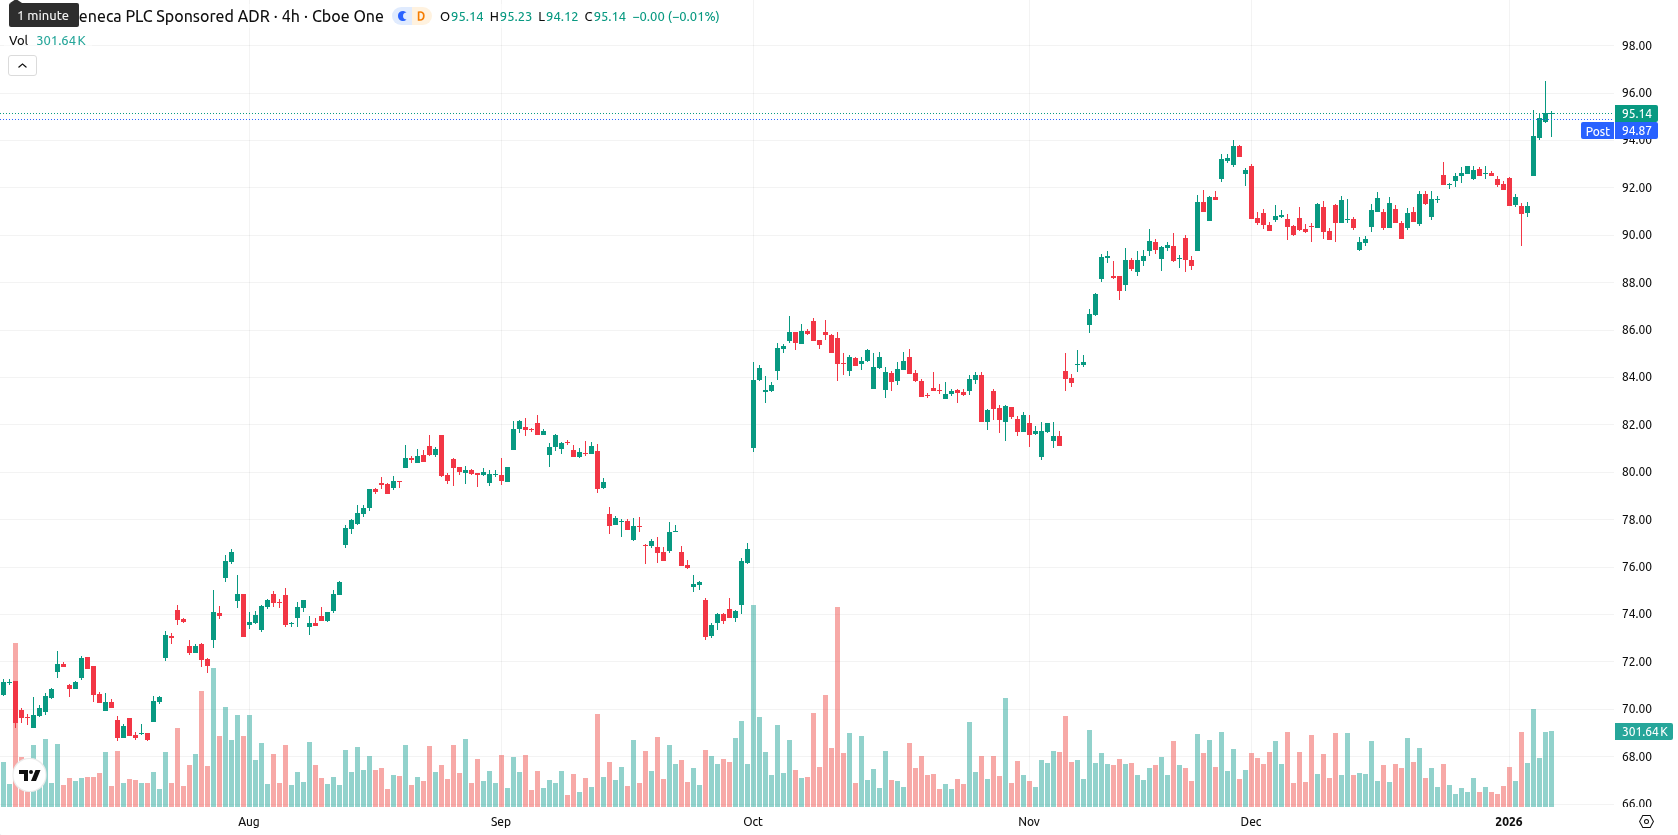
AstraZeneca PLC (AZN) is trading at GBX 14,225.00, showing a daily gain of GBX 187.00 or 1.33%. The share price is well above the MA-20 (GBX 13,658.03), MA-50 (GBX 13,454.57), and MA-200 (GBX 11,672.73), confirming strong bullish momentum across all key timeframes.
Highlights
- AstraZeneca reported total revenue of $43.2 billion for the first nine months of 2025, up 11%, with core EPS rising 15% to $7.04, beating market expectations.
- The company is advancing its late-stage drug pipeline, investing in obesity and autoimmune CAR-T therapies, and expanding US manufacturing capacity.
- AstraZeneca's Vietnamese subsidiary underscores its sustainability focus, while recent increases in insider share sales signal evolving internal sentiment.
Earnings beat and drug pipeline strengthen investor conviction
AstraZeneca delivered robust financial results for the first nine months of 2025, with total revenue up 11% at $43.2 billion and core EPS rising 15% to $7.04, exceeding market expectations. Strategic developments include continued investment in its late-stage drug pipeline, initiatives in obesity and autoimmune CAR-T therapies, expanded US manufacturing, and a focus on sustainable business through its Vietnamese subsidiary. Recent increases in insider share sales also reflect evolving internal sentiment.
Overbought signals compete with persistent upside momentum
The technical setup for AZN remains bullish with prices significantly above all major moving averages. The dynamic resistance is at the Ichimoku Kijun level of GBX 14,376.18, while strong support is seen at the MA-50. Momentum indicators such as MACD and ADX confirm ongoing buyer strength. However, RSI, Stochastic RSI, and CCI show overbought conditions, warning of possible short-term overheating. The Bull/Bear Power indicator and Awesome Oscillator continue to signal strong demand and persistent positive momentum, but rising volatility and emerging divergence on oscillators suggest caution for new positions.
Further price gains likely as volatility brackets upside risk
For the next five trading days, AZN is likely to trade within a typical volatility band of GBX 13,950 to GBX 14,450. There is a strong (over 80%) chance of further price increases, supported by robust technical signals. In a bullish scenario, a break above GBX 14,376.18 could lead to further gains toward GBX 14,450, while a move below GBX 13,950 may trigger a correction toward the MA-50; however, a downside shift remains unlikely unless technical momentum fades.
Last time, analysts noted that AstraZeneca PLC was trading above its key moving averages with strong bullish momentum confirmed by positive MACD and ADX signals, although overbought oscillators such as RSI and Stochastic RSI suggested the stock was stretched in the short term. Price action was expected to consolidate between established support and resistance levels, with buyers maintaining upward pressure and a high probability of further gains if a breakout occurred above technical resistance.


Latest AstraZeneca News


-
 Afghanistan
-
 Albania
-
 Algeria
-
 Angola
-
 Argentina
-
 Armenia
-
 Australia
-
 Austria
-
 Azerbaijan
-
 Bahamas
-
 Bahrain
-
 Bangladesh
-
 Belarus
-
 Belgium
-
 Bolivia
-
 Botswana
-
 Brazil
-
 Brunei
-
 Bulgaria
-
 Cambodia
-
 Cameroon
-
 Canada
-
 Chile
Chile
-
 China
China
-
 Colombia
-
 Congo
Congo
-
 Costa Rica
-
 Cote d'Ivoire
-
 Croatia
-
 Cuba
Cuba
-
 Cyprus
-
 Czechia
-
 DR Congo
-
 Denmark
-
 Dominican Republic
-
 Ecuador
-
 Egypt
Egypt
-
 El Salvador
-
 Estonia
-
 Eswatini
-
 Ethiopia
-
 Finland
-
 France
-
 Georgia
-
 Germany
-
 Ghana
Ghana
-
 Greece
-
 Haiti
Haiti
-
 Hong Kong
-
 Hungary
-
 India
India
-
 Indonesia
-
 Iran, Islamic republic
-
 Iraq
Iraq
-
 Ireland
-
 Israel
-
 Italy
Italy
-
 Jamaica
-
 Japan
Japan
-
 Jordan
-
 Kazakhstan
-
 Kenya
Kenya
-
 Korea
Korea
-
 Kuwait
-
 Kyrgyzstan
-
 Laos
Laos
-
 Latvia
-
 Lebanon
-
 Lesotho
-
 Libya
Libya
-
 Lithuania
-
 Luxembourg
-
 Madagascar
-
 Malaysia
-
 Malta
Malta
-
 Mauritius
-
 Mexico
-
 Moldova
-
 Mongolia
-
 Montenegro
-
 Morocco
-
 Mozambique
-
 Myanmar
-
 Namibia
-
 Nepal
Nepal
-
 Netherlands
-
 New Zealand
-
 Nigeria
-
 North Macedonia
-
 Norway
-
 Oman
Oman
-
 Pakistan
-
 Palestine
-
 Panama
-
 Papua New Guinea
-
 Paraguay
-
 Peru
Peru
-
 Philippines
-
 Poland
-
 Portugal
-
 Puerto Rico
-
 Qatar
Qatar
-
 Reunion
-
 Romania
-
 Rwanda
-
 Saudi Arabia
-
 Serbia
-
 Singapore
-
 Slovakia
-
 Slovenia
-
 Somalia
-
 South Africa
-
 Spain
Spain
-
 Sri Lanka
-
 Sweden
-
 Switzerland
-
 Syria
Syria
-
 Taiwan
-
 Tajikistan
-
 Tanzania
-
 Thailand
-
 Trinidad and Tobago
-
 Tunisia
-
 Turkey
-
 UAE
UAE
-
 Uganda
-
 Ukraine
-
 United Kingdom
-
United States
-
 Uruguay
-
 Uzbekistan
-
 Venezuela
-
 Vietnam
-
 Yemen
Yemen
-
 Zambia
-
 Zimbabwe
- Forex
- Crypto
