
MercadoLibre stock price forecast: short-term exhaustion as MELI declines 1.12% toward $2,100 support

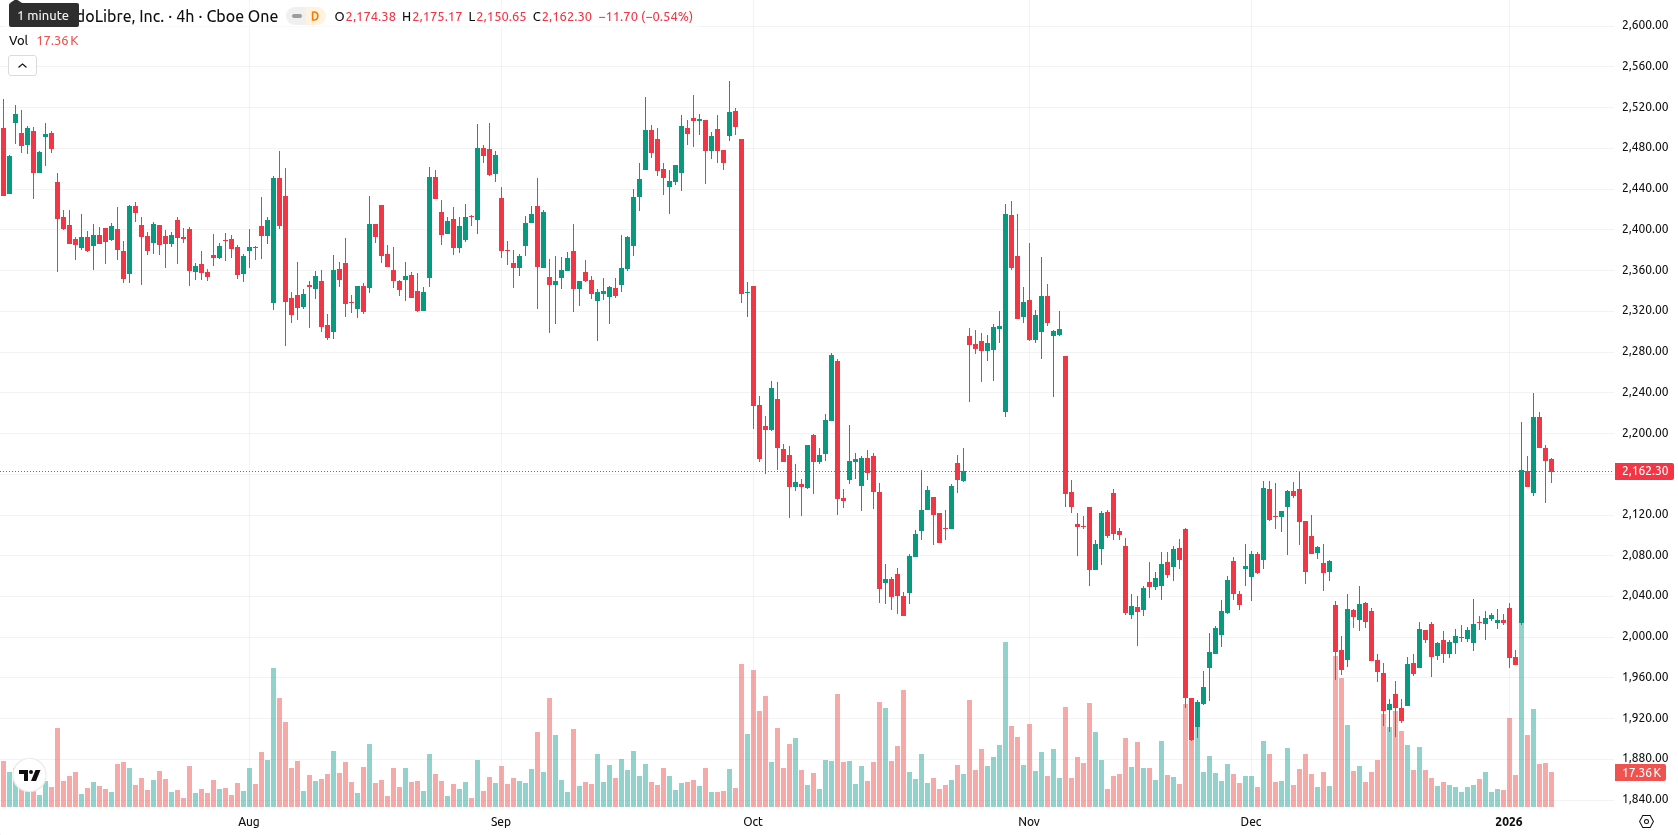
MercadoLibre Inc (MELI) is trading at $2,162.61, having pulled back 1.12% today and currently hovering near its session lows after a volatile session. The price remains above the 20-day ($2,018.72) and 50-day ($2,085.52) moving averages, but below the 200-day mark ($2,269.09), signaling persistent long-term resistance despite recent short- and medium-term strength.
Highlights
- DSM Capital Partners LLC increased its stake in MercadoLibre by 66.2% during Q3, indicating strong institutional confidence in the company's outlook.
- Mercado Pago became the leading credit card issuer in Brazil, fueling growth in transaction volumes and advertising revenue for MercadoLibre.
- MercadoLibre reported quarterly earnings of $8.32 per share on $7.41 billion in revenue, narrowly missing analyst estimates.
Stake increases and payment dominance drive investor optimism amid mixed results
MercadoLibre continues to demonstrate strong growth as recent regulatory filings show DSM Capital Partners LLC increased its stake in the company by 66.2% during the third quarter, signaling confidence in its future. The Mercado Pago payment platform has been recognized as the leading credit card issuer in Brazil, contributing to higher transaction volumes and advertising revenue. Quarterly earnings came in at $8.32 per share on $7.41 billion in revenue, just below analyst expectations.
Mixed oscillators and overbought signals suggest seller shift after volatile open
Momentum signals on the daily chart are mixed. The MACD is neutral and the ADX shows a weak trend, while the Relative Strength Index indicates bullish conditions. Multiple oscillators (Stochastic RSI, CCI, Bull/Bear Power) show overbought readings, suggesting potential short-term exhaustion. Bull/Bear Power favors buyers, confirmed by continued support from the Awesome Oscillator. The stock opened nearly flat with only a small gap from the previous close, pulled back 1.12%, and currently sits near today’s low after a volatile session, indicating pressure after the open and a shift in intraday sentiment toward sellers, despite buyer strength in recent days.
Downside risk dominates as price poised to test key volatility band
For the next five trading days, MELI is expected to fluctuate within the typical volatility band of $2,100–$2,200. The probability of a price increase remains very low (less than 20%), so a decrease is much more likely. The baseline scenario points to sideways movement between $2,100 and $2,200, with resistance at $2,200 and support at $2,100. A breakout above $2,200 could see a move toward $2,250, while a decline below $2,100 may open downside to the MA-50 near $2,080.
Last time, analysts noted that MercadoLibre Inc. was trading above its short- and medium-term moving averages but remained below its long-term MA, signaling ongoing momentum with longer-term resistance overhead. Technical indicators are mixed with overbought readings from RSI and oscillators, while neutral MACD and weak ADX suggest sideways consolidation within established support and resistance levels.


Latest MercadoLibre News


-
 Afghanistan
-
 Albania
-
 Algeria
-
 Angola
-
 Argentina
-
 Armenia
-
 Australia
-
 Austria
-
 Azerbaijan
-
 Bahamas
-
 Bahrain
-
 Bangladesh
-
 Belarus
-
 Belgium
-
 Bolivia
-
 Botswana
-
 Brazil
-
 Brunei
-
 Bulgaria
-
 Cambodia
-
 Cameroon
-
 Canada
-
 Chile
Chile
-
 China
China
-
 Colombia
-
 Congo
Congo
-
 Costa Rica
-
 Cote d'Ivoire
-
 Croatia
-
 Cuba
Cuba
-
 Cyprus
-
 Czechia
-
 DR Congo
-
 Denmark
-
 Dominican Republic
-
 Ecuador
-
 Egypt
Egypt
-
 El Salvador
-
 Estonia
-
 Eswatini
-
 Ethiopia
-
 Finland
-
 France
-
 Georgia
-
 Germany
-
 Ghana
Ghana
-
 Greece
-
 Haiti
Haiti
-
 Hong Kong
-
 Hungary
-
 India
India
-
 Indonesia
-
 Iran, Islamic republic
-
 Iraq
Iraq
-
 Ireland
-
 Israel
-
 Italy
Italy
-
 Jamaica
-
 Japan
Japan
-
 Jordan
-
 Kazakhstan
-
 Kenya
Kenya
-
 Korea
Korea
-
 Kuwait
-
 Kyrgyzstan
-
 Laos
Laos
-
 Latvia
-
 Lebanon
-
 Lesotho
-
 Libya
Libya
-
 Lithuania
-
 Luxembourg
-
 Madagascar
-
 Malaysia
-
 Malta
Malta
-
 Mauritius
-
 Mexico
-
 Moldova
-
 Mongolia
-
 Montenegro
-
 Morocco
-
 Mozambique
-
 Myanmar
-
 Namibia
-
 Nepal
Nepal
-
 Netherlands
-
 New Zealand
-
 Nigeria
-
 North Macedonia
-
 Norway
-
 Oman
Oman
-
 Pakistan
-
 Palestine
-
 Panama
-
 Papua New Guinea
-
 Paraguay
-
 Peru
Peru
-
 Philippines
-
 Poland
-
 Portugal
-
 Puerto Rico
-
 Qatar
Qatar
-
 Reunion
-
 Romania
-
 Rwanda
-
 Saudi Arabia
-
 Serbia
-
 Singapore
-
 Slovakia
-
 Slovenia
-
 Somalia
-
 South Africa
-
 Spain
Spain
-
 Sri Lanka
-
 Sweden
-
 Switzerland
-
 Syria
Syria
-
 Taiwan
-
 Tajikistan
-
 Tanzania
-
 Thailand
-
 Trinidad and Tobago
-
 Tunisia
-
 Turkey
-
 UAE
UAE
-
 Uganda
-
 Ukraine
-
 United Kingdom
-
United States
-
 Uruguay
-
 Uzbekistan
-
 Venezuela
-
 Vietnam
-
 Yemen
Yemen
-
 Zambia
-
 Zimbabwe
- Forex
- Crypto
