
Globalstar stock falls 9.58% as technical signals turn bearish and support is tested

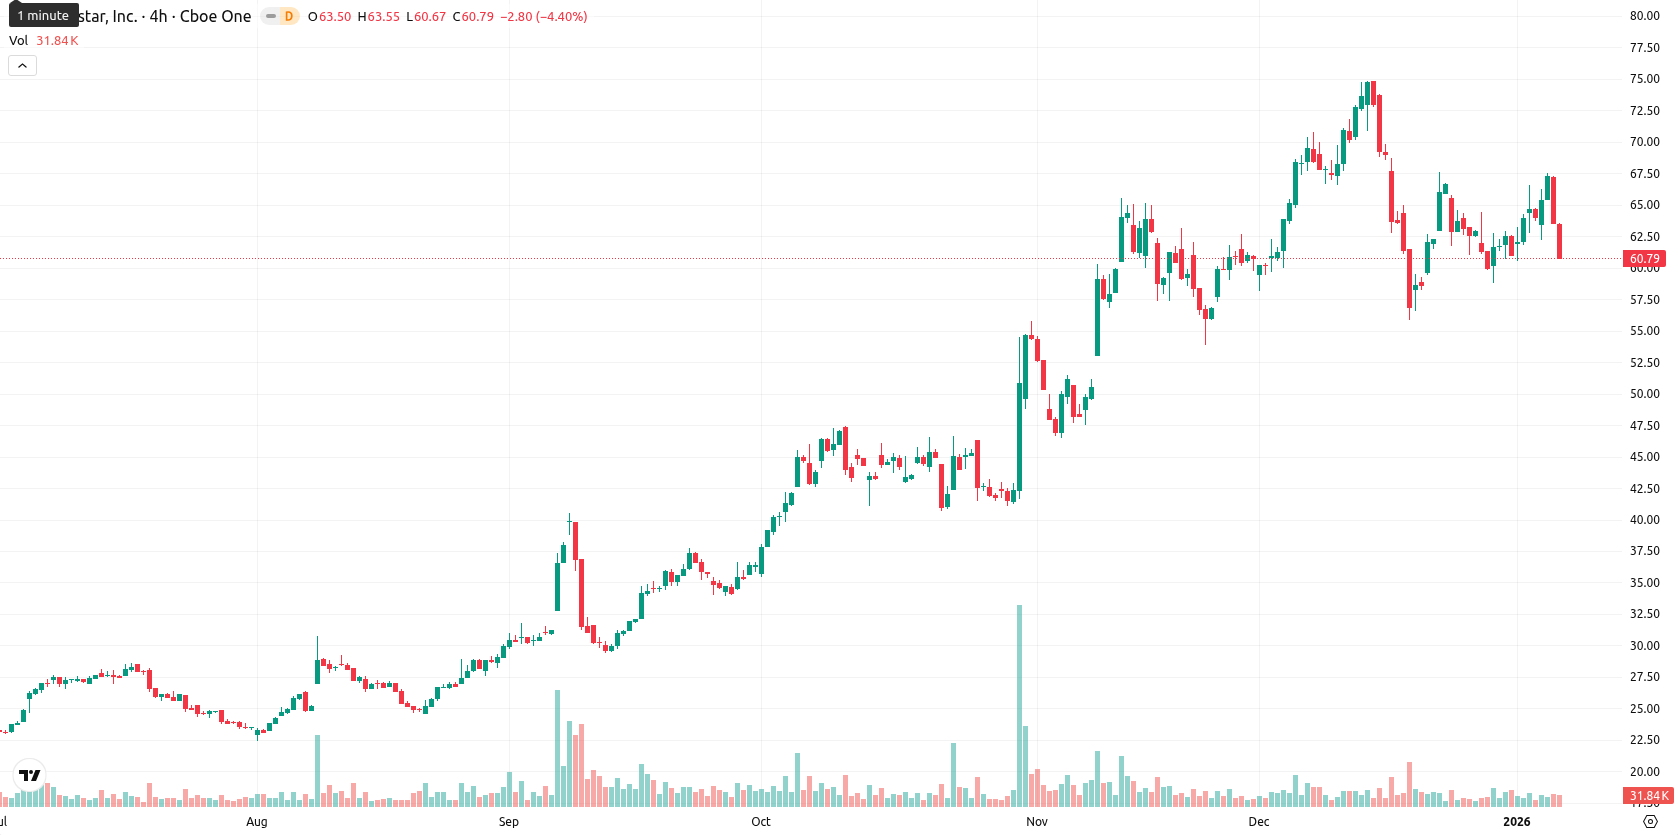
Globalstar, Inc. (GSAT) is trading at $60.85 after falling 9.58% today. The price is currently below both the MA-20 ($64.56) and MA-50 ($60.07), but remains well above the MA-200 ($35.04), signaling short-term and medium-term downside pressure but a longer-term bullish trend with strong underlying support.
Highlights
- Globalstar CEO Paul E. Jacobs sold 845 shares on January 7, 2026, totaling $55,601, reducing his direct and indirect holdings.
- The insider transaction signals ongoing executive engagement, as Jacobs retains exposure despite reducing his stake in Globalstar.
- Globalstar has maintained business momentum over the past year, with leadership actions cited as contributing factors.
Insider sale by CEO underscores active leadership despite recent stock decline
Globalstar recently saw insider activity, as CEO Paul E. Jacobs sold 845 shares on January 7, 2026, for a total of $55,601. This transaction leaves Jacobs with direct and indirect holdings in the company. Over the past year, Globalstar has maintained momentum due in part to continued leadership engagement.
Mixed signals from momentum and oscillators as support holds above MA-200
Technical analysis shows GSAT trading below its MA-20 and MA-50, yet well above the MA-200, indicating persistent near-term selling pressure but longer-term support. Resistance stands near the Ichimoku Kijun at $65.33, while the key support level is met at the MA-50 ($60.07). Momentum readings are mixed: the MACD remains strongly bullish and the ADX signals a moderate trend, but oscillators like the RSI (47.31), Stochastic RSI (strong sell), and CCI (neutral but near oversold) point to weakening momentum and approaching oversold conditions. Bull/Bear Power flags residual overbought signals daily, though intraday periods are now oversold, reflecting heavy selling throughout today's session. The Awesome Oscillator adds a slight bullish undertone balancing the prevailing bearish momentum.
Rebound probability rises as price consolidates within defined volatility band
Over the next five trading days, GSAT is likely to fluctuate within a volatility band between $56.75 and $65.00, as the market processes recent declines. The odds of a rebound are elevated, with over an 80% probability of the price moving higher, while further downside is less probable. A consolidation within this range is most likely, but a breakout above $65.33 could see a move toward the top of the band, while a drop below $60.00 would increase the risk of testing support at the lower end.
Last time, analysts noted that Globalstar Inc. (GSAT) experienced a sharp daily decline, with the price falling below the 20-day moving average and Ichimoku Kijun, yet holding just above medium-term support at the 50-day MA. While momentum indicators are mixed—MACD and the Awesome Oscillator support longer-term bullish potential, short-term oscillators reflect persistent downward momentum and increasing caution amid diverging signals.


Latest Globalstar News


-
 Afghanistan
-
 Albania
-
 Algeria
-
 Angola
-
 Argentina
-
 Armenia
-
 Australia
-
 Austria
-
 Azerbaijan
-
 Bahamas
-
 Bahrain
-
 Bangladesh
-
 Belarus
-
 Belgium
-
 Bolivia
-
 Botswana
-
 Brazil
-
 Brunei
-
 Bulgaria
-
 Cambodia
-
 Cameroon
-
 Canada
-
 Chile
Chile
-
 China
China
-
 Colombia
-
 Congo
Congo
-
 Costa Rica
-
 Cote d'Ivoire
-
 Croatia
-
 Cuba
Cuba
-
 Cyprus
-
 Czechia
-
 DR Congo
-
 Denmark
-
 Dominican Republic
-
 Ecuador
-
 Egypt
Egypt
-
 El Salvador
-
 Estonia
-
 Eswatini
-
 Ethiopia
-
 Finland
-
 France
-
 Georgia
-
 Germany
-
 Ghana
Ghana
-
 Greece
-
 Haiti
Haiti
-
 Hong Kong
-
 Hungary
-
 India
India
-
 Indonesia
-
 Iran, Islamic republic
-
 Iraq
Iraq
-
 Ireland
-
 Israel
-
 Italy
Italy
-
 Jamaica
-
 Japan
Japan
-
 Jordan
-
 Kazakhstan
-
 Kenya
Kenya
-
 Korea
Korea
-
 Kuwait
-
 Kyrgyzstan
-
 Laos
Laos
-
 Latvia
-
 Lebanon
-
 Lesotho
-
 Libya
Libya
-
 Lithuania
-
 Luxembourg
-
 Madagascar
-
 Malaysia
-
 Malta
Malta
-
 Mauritius
-
 Mexico
-
 Moldova
-
 Mongolia
-
 Montenegro
-
 Morocco
-
 Mozambique
-
 Myanmar
-
 Namibia
-
 Nepal
Nepal
-
 Netherlands
-
 New Zealand
-
 Nigeria
-
 North Macedonia
-
 Norway
-
 Oman
Oman
-
 Pakistan
-
 Palestine
-
 Panama
-
 Papua New Guinea
-
 Paraguay
-
 Peru
Peru
-
 Philippines
-
 Poland
-
 Portugal
-
 Puerto Rico
-
 Qatar
Qatar
-
 Reunion
-
 Romania
-
 Rwanda
-
 Saudi Arabia
-
 Serbia
-
 Singapore
-
 Slovakia
-
 Slovenia
-
 Somalia
-
 South Africa
-
 Spain
Spain
-
 Sri Lanka
-
 Sweden
-
 Switzerland
-
 Syria
Syria
-
 Taiwan
-
 Tajikistan
-
 Tanzania
-
 Thailand
-
 Trinidad and Tobago
-
 Tunisia
-
 Turkey
-
 UAE
UAE
-
 Uganda
-
 Ukraine
-
 United Kingdom
-
United States
-
 Uruguay
-
 Uzbekistan
-
 Venezuela
-
 Vietnam
-
 Yemen
Yemen
-
 Zambia
-
 Zimbabwe
- Forex
- Crypto
