
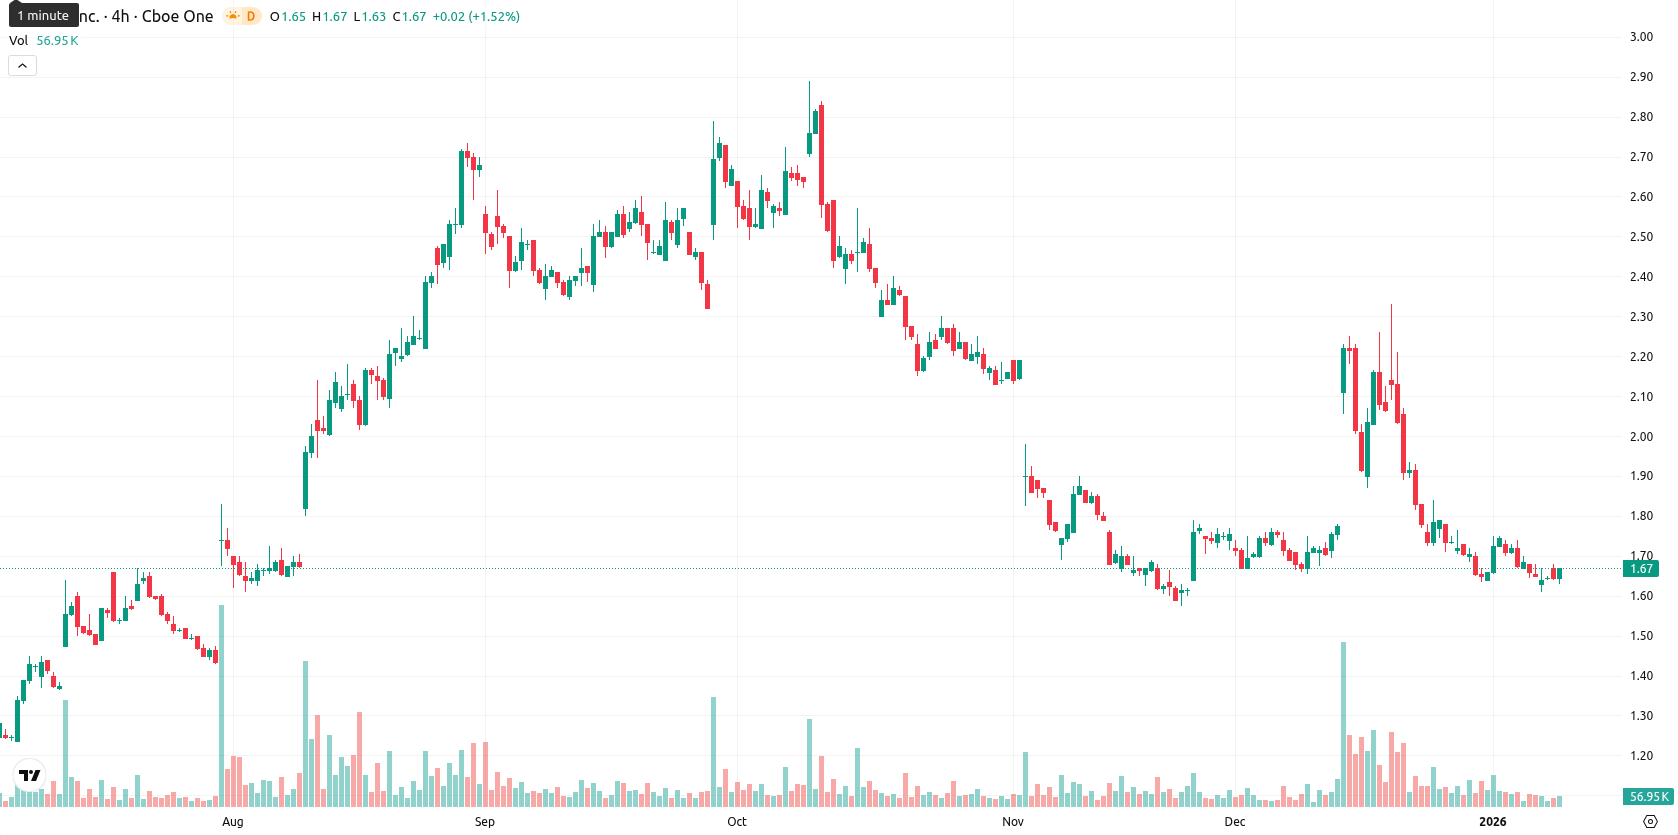
Sundial Growers stock gains 1.22% as oversold conditions spark mild rebound hopes

Sundial Growers Inc. (SNDL) is trading at $1.66, which is below the MA-20 ($1.81), MA-50 ($1.80), and MA-200 ($1.78), indicating the price is under pressure from sellers across short-, medium-, and long-term trends. The nearest dynamic resistance is seen at the Ichimoku Kijun level of $1.98, while MA-50 and MA-200, both above the current price, reinforce the overall bearish technical backdrop.
Highlights
- SNDL trades at $1.66, below MA-20 ($1.81), MA-50 ($1.80), and MA-200 ($1.78), reflecting persistent selling pressure across all time frames.
- Momentum remains weak with MACD in sell territory, ADX at 13.95, and Bear Power at –0.04, while Stochastic RSI signals oversold conditions and mild intraday buying.
- Expect SNDL to move between $1.61 and $1.71 over the next five trading days, with less than 20% probability of price increasing and further declines more likely.
Weak momentum meets oversold signals as rebound risk emerges
Momentum signals are weak, with the MACD on D1 in sell territory and the ADX value of 13.95 reflecting a lack of strong trend strength. The RSI and Commodity Channel Index hover in bearish zones, while the Stochastic RSI reveals an oversold condition, highlighting some potential for a technical rebound. Bull/Bear Power remains negative at –0.04, confirming that sellers still dominate intraday momentum. Daily action saw a slight positive move — up 1.22% — with no gap between the previous close and today’s open, and price standing near the upper end of today’s range amid low intraday volatility and mild post-open buying pressure. There is a clear divergence, as momentum remains weak while oversold oscillators may tempt short-term bargain hunters.
Further declines favored as downside signals override mild support
Looking ahead to the next five trading days, the expected price corridor is $1.61 to $1.71, normalized around the current price and reflecting recent volatility. The probability of a further price increase is very low (less than 20%), making further declines considerably more likely given the dominant sell signals across weekly Moving Averages, RSI, and MACD. The baseline scenario suggests sideways movement between $1.61 and $1.71, barring new catalysts. A bullish outcome would require a move above resistance levels toward $1.71, while a bearish scenario could see the price slipping below $1.61 if selling intensifies.
Last time, analysts noted that Sundial Growers Inc. was trading below key moving averages, with persistent bearish momentum reflected by weak MACD, oversold oscillators, and a neutral ADX, suggesting sustained selling pressure across all timeframes. Immediate support remains at $1.64 with resistance at $1.88–$1.99, and indicators continue to favor a downside bias within a broadly sideways price range.


-
 Afghanistan
-
 Albania
-
 Algeria
-
 Angola
-
 Argentina
-
 Armenia
-
 Australia
-
 Austria
-
 Azerbaijan
-
 Bahamas
-
 Bahrain
-
 Bangladesh
-
 Belarus
-
 Belgium
-
 Bolivia
-
 Botswana
-
 Brazil
-
 Brunei
-
 Bulgaria
-
 Cambodia
-
 Cameroon
-
 Canada
-
 Chile
Chile
-
 China
China
-
 Colombia
-
 Congo
Congo
-
 Costa Rica
-
 Cote d'Ivoire
-
 Croatia
-
 Cuba
Cuba
-
 Cyprus
-
 Czechia
-
 DR Congo
-
 Denmark
-
 Dominican Republic
-
 Ecuador
-
 Egypt
Egypt
-
 El Salvador
-
 Estonia
-
 Eswatini
-
 Ethiopia
-
 Finland
-
 France
-
 Georgia
-
 Germany
-
 Ghana
Ghana
-
 Greece
-
 Haiti
Haiti
-
 Hong Kong
-
 Hungary
-
 India
India
-
 Indonesia
-
 Iran, Islamic republic
-
 Iraq
Iraq
-
 Ireland
-
 Israel
-
 Italy
Italy
-
 Jamaica
-
 Japan
Japan
-
 Jordan
-
 Kazakhstan
-
 Kenya
Kenya
-
 Korea
Korea
-
 Kuwait
-
 Kyrgyzstan
-
 Laos
Laos
-
 Latvia
-
 Lebanon
-
 Lesotho
-
 Libya
Libya
-
 Lithuania
-
 Luxembourg
-
 Madagascar
-
 Malaysia
-
 Malta
Malta
-
 Mauritius
-
 Mexico
-
 Moldova
-
 Mongolia
-
 Montenegro
-
 Morocco
-
 Mozambique
-
 Myanmar
-
 Namibia
-
 Nepal
Nepal
-
 Netherlands
-
 New Zealand
-
 Nigeria
-
 North Macedonia
-
 Norway
-
 Oman
Oman
-
 Pakistan
-
 Palestine
-
 Panama
-
 Papua New Guinea
-
 Paraguay
-
 Peru
Peru
-
 Philippines
-
 Poland
-
 Portugal
-
 Puerto Rico
-
 Qatar
Qatar
-
 Reunion
-
 Romania
-
 Rwanda
-
 Saudi Arabia
-
 Serbia
-
 Singapore
-
 Slovakia
-
 Slovenia
-
 Somalia
-
 South Africa
-
 Spain
Spain
-
 Sri Lanka
-
 Sweden
-
 Switzerland
-
 Syria
Syria
-
 Taiwan
-
 Tajikistan
-
 Tanzania
-
 Thailand
-
 Trinidad and Tobago
-
 Tunisia
-
 Turkey
-
 UAE
UAE
-
 Uganda
-
 Ukraine
-
 United Kingdom
-
United States
-
 Uruguay
-
 Uzbekistan
-
 Venezuela
-
 Vietnam
-
 Yemen
Yemen
-
 Zambia
-
 Zimbabwe
- Forex
- Crypto
