
AstraZeneca stock price forecast: Further consolidation expected as AZN holds above critical supports

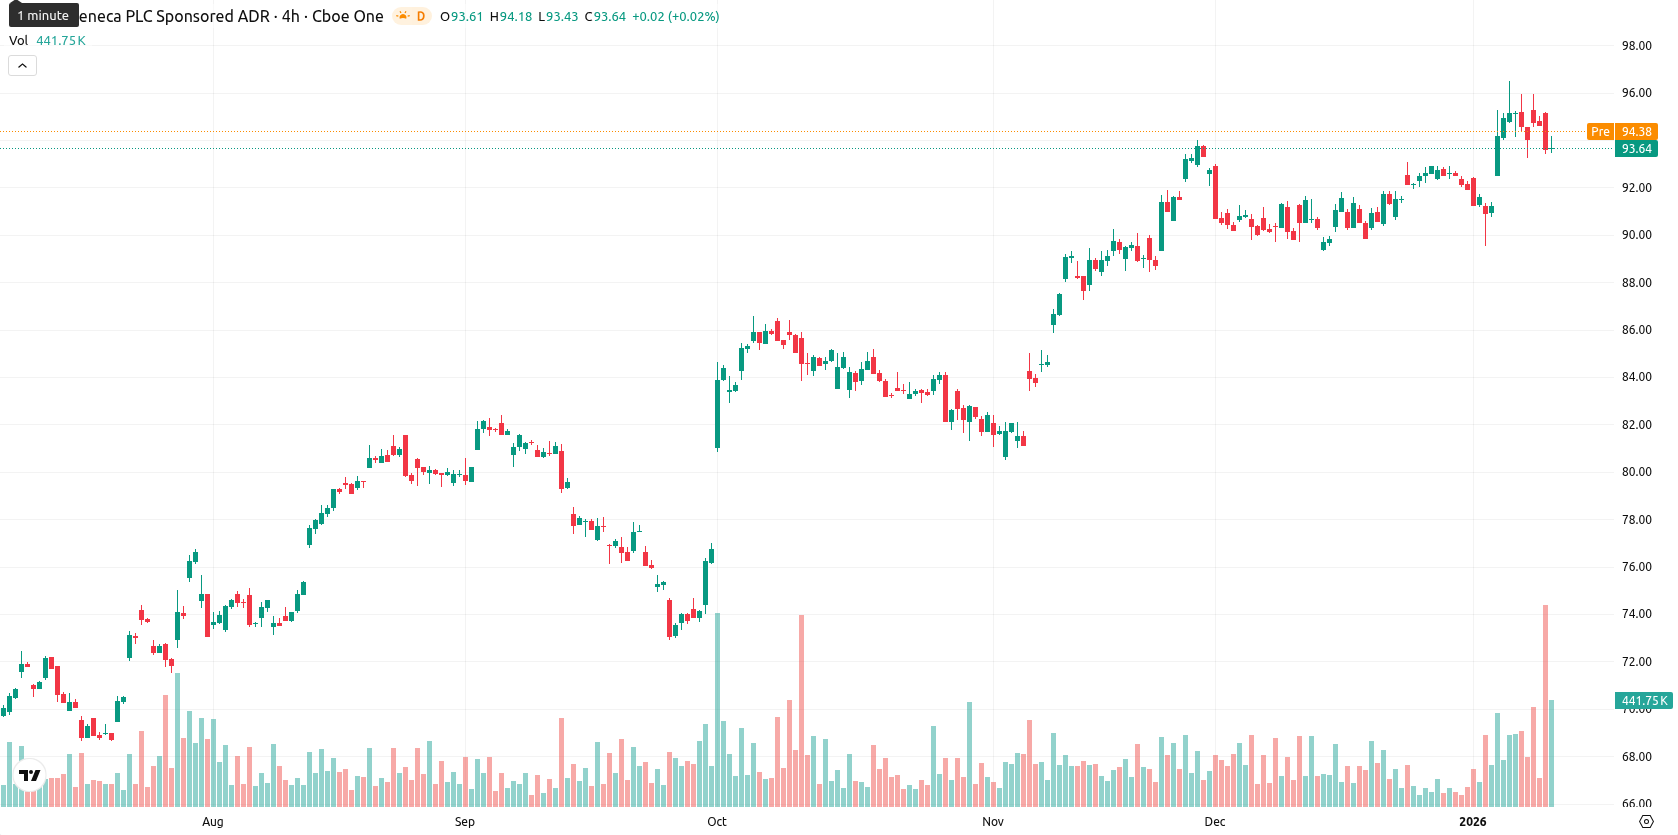
AstraZeneca PLC (AZN) is trading at GBX 14,012.00, showing a modest intraday decline of 0.76%. The price remains above the MA-20 (GBX 13,750.80), MA-50 (GBX 13,555.12), and well above MA-200 (GBX 11,716.71), confirming a strong bullish structure across all major timeframes.
Highlights
- AstraZeneca will be removed from several major Nasdaq indexes, including the Nasdaq-100, effective prior to market opening on January 20 as part of a scheduled adjustment.
- AstraZeneca appointed Rick Suarez to lead its U.S. biopharmaceuticals division and oversee the execution of a USD 50 billion expansion initiative.
- Recent discussions have emphasized potential headwinds for AstraZeneca from patent challenges and government pricing dynamics.
Index removals and leadership changes reshape growth narrative amid policy risks
AstraZeneca is set to be removed from several major Nasdaq indexes, including the Nasdaq-100, effective prior to the market opening on January 20, as part of a scheduled adjustment by Nasdaq. The company also named Rick Suarez to lead its U.S. biopharmaceuticals division, appointing him to oversee the execution of a USD 50 billion expansion initiative. Recent discussions have emphasized potential headwinds from patent challenges and government pricing dynamics.
Bullish momentum persists as overbought signals counter mid-range consolidation
The technical outlook remains constructive as AZN continues to trade above the MA-20, MA-50, and MA-200 levels, reinforcing short-, medium-, and long-term bullish momentum. The closest dynamic support is at the Ichimoku Kijun (GBX 14,376.18), while the MA-50 offers secondary support on any weakness. The MACD and ADX on the daily chart point to ongoing bullish momentum, supported by the Awesome Oscillator, while both the RSI and CCI sit in buy territory though nearing overbought conditions. Contrastingly, the Stochastic RSI signals a strong sell and the Bull/Bear Power indicates an overbought state, with the current session seeing a visible downside gap and moderate volatility, as prices consolidate mid-range.
Consolidation favored as upside bias dominates near-term trading range
For the next five trading days, AZN is expected to consolidate within a typical volatility band between GBX 14,000 and GBX 14,950, in line with recent patterns. The probability of a short-term price increase remains above 80%, making a significant decline less likely in the immediate term. A sideways consolidation is the base case, while a bullish breakout above the Ichimoku Kijun near GBX 14,376 may open a move toward GBX 14,950, and a breakdown below MA-20 support at GBX 13,750 could prompt a retreat toward MA-50 around GBX 13,555.
Last time, analysts noted AstraZeneca PLC remained in a strong bullish trend, trading well above its key moving averages with continued positive signals from MACD and ADX, while the RSI and other oscillators flagged overbought conditions that may limit immediate upside. Near-term resistance is seen at the Ichimoku Kijun, with dynamic support from the MA-50, and any sustained move below this support would increase downside risks.


Latest AstraZeneca News


-
 Afghanistan
-
 Albania
-
 Algeria
-
 Angola
-
 Argentina
-
 Armenia
-
 Australia
-
 Austria
-
 Azerbaijan
-
 Bahamas
-
 Bahrain
-
 Bangladesh
-
 Belarus
-
 Belgium
-
 Bolivia
-
 Botswana
-
 Brazil
-
 Brunei
-
 Bulgaria
-
 Cambodia
-
 Cameroon
-
 Canada
-
 Chile
Chile
-
 China
China
-
 Colombia
-
 Congo
Congo
-
 Costa Rica
-
 Cote d'Ivoire
-
 Croatia
-
 Cuba
Cuba
-
 Cyprus
-
 Czechia
-
 DR Congo
-
 Denmark
-
 Dominican Republic
-
 Ecuador
-
 Egypt
Egypt
-
 El Salvador
-
 Estonia
-
 Eswatini
-
 Ethiopia
-
 Finland
-
 France
-
 Georgia
-
 Germany
-
 Ghana
Ghana
-
 Greece
-
 Haiti
Haiti
-
 Hong Kong
-
 Hungary
-
 India
India
-
 Indonesia
-
 Iran, Islamic republic
-
 Iraq
Iraq
-
 Ireland
-
 Israel
-
 Italy
Italy
-
 Jamaica
-
 Japan
Japan
-
 Jordan
-
 Kazakhstan
-
 Kenya
Kenya
-
 Korea
Korea
-
 Kuwait
-
 Kyrgyzstan
-
 Laos
Laos
-
 Latvia
-
 Lebanon
-
 Lesotho
-
 Libya
Libya
-
 Lithuania
-
 Luxembourg
-
 Madagascar
-
 Malaysia
-
 Malta
Malta
-
 Mauritius
-
 Mexico
-
 Moldova
-
 Mongolia
-
 Montenegro
-
 Morocco
-
 Mozambique
-
 Myanmar
-
 Namibia
-
 Nepal
Nepal
-
 Netherlands
-
 New Zealand
-
 Nigeria
-
 North Macedonia
-
 Norway
-
 Oman
Oman
-
 Pakistan
-
 Palestine
-
 Panama
-
 Papua New Guinea
-
 Paraguay
-
 Peru
Peru
-
 Philippines
-
 Poland
-
 Portugal
-
 Puerto Rico
-
 Qatar
Qatar
-
 Reunion
-
 Romania
-
 Rwanda
-
 Saudi Arabia
-
 Serbia
-
 Singapore
-
 Slovakia
-
 Slovenia
-
 Somalia
-
 South Africa
-
 Spain
Spain
-
 Sri Lanka
-
 Sweden
-
 Switzerland
-
 Syria
Syria
-
 Taiwan
-
 Tajikistan
-
 Tanzania
-
 Thailand
-
 Trinidad and Tobago
-
 Tunisia
-
 Turkey
-
 UAE
UAE
-
 Uganda
-
 Ukraine
-
 United Kingdom
-
United States
-
 Uruguay
-
 Uzbekistan
-
 Venezuela
-
 Vietnam
-
 Yemen
Yemen
-
 Zambia
-
 Zimbabwe
- Forex
- Crypto
