
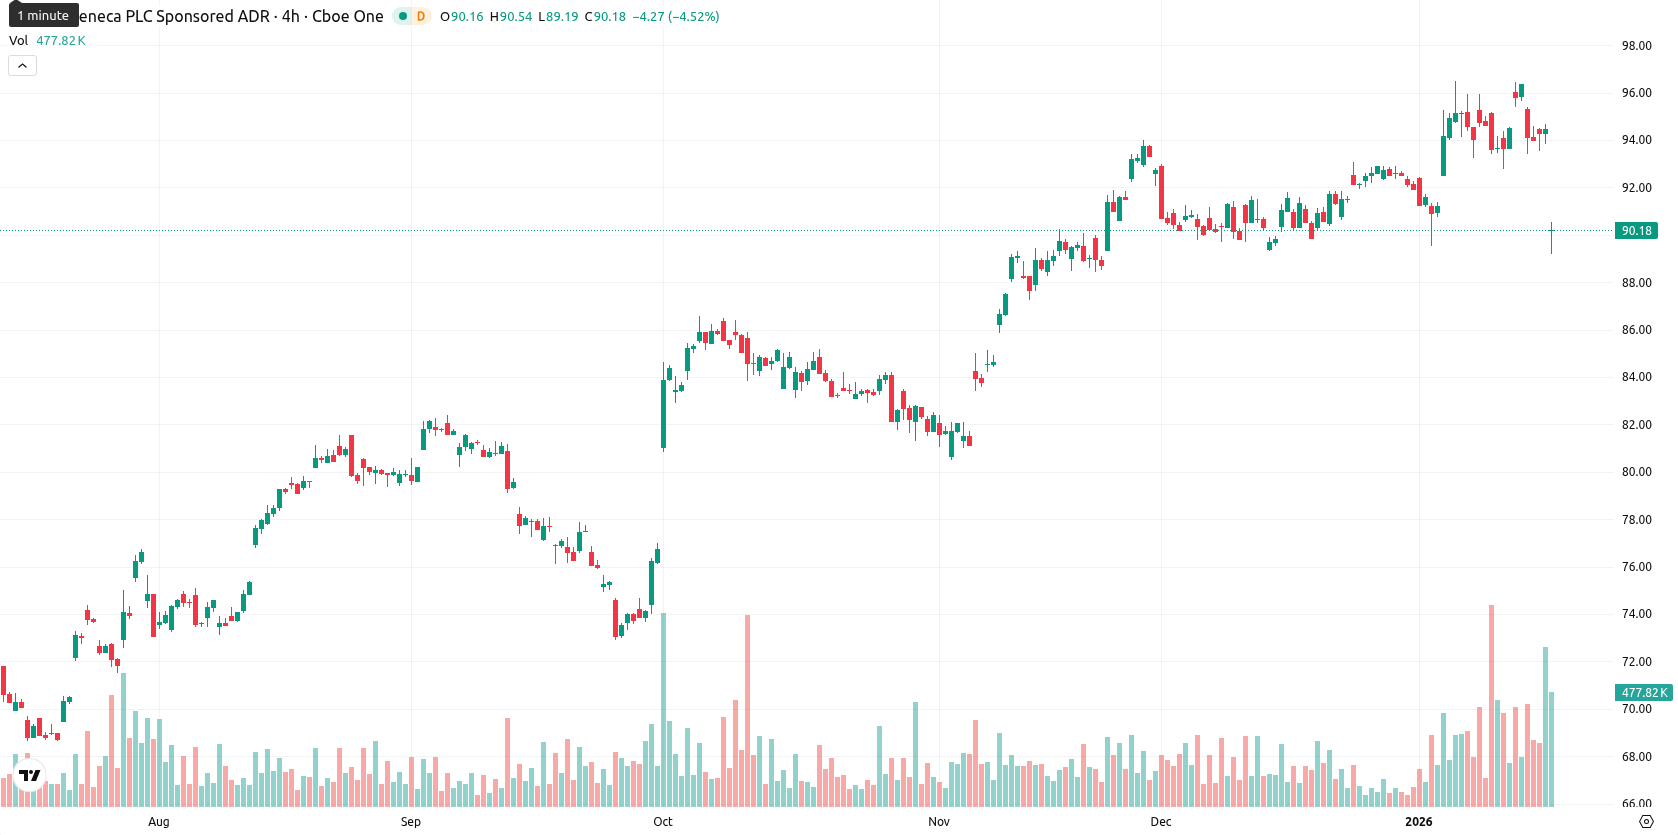
-3.67% for AstraZeneca stock — heightened volatility amid NYSE switch and regulatory headlines

AstraZeneca PLC (AZN) is trading at GBX 13,380.00, which places it below both its MA-20 (GBX 13,886.10) and MA-50 (GBX 13,716.32), but still significantly above its long-term MA-200 (GBX 11,785.52). This configuration indicates short- and medium-term selling pressure, while the broader trend is still bullish.
Highlights
- AstraZeneca will voluntarily withdraw its American Depositary Shares and certain debt securities from the Nasdaq, targeting a direct NYSE listing by February 2026 to harmonize global listings.
- The European Medicines Agency validated a Type II Variation application for Enhertu plus pertuzumab as a treatment for HER2 positive metastatic breast cancer.
- AstraZeneca reported positive Phase III trial results for Saphnelo in patients with systemic lupus erythematosus.
Listing overhaul and trial updates drive sentiment shifts for AstraZeneca
AstraZeneca has announced the voluntary withdrawal of its American Depositary Shares and certain debt securities from the Nasdaq, with plans to directly list these securities on the NYSE in February 2026 as part of a move to harmonize its global listing structure. The European Medicines Agency has validated a Type II Variation application for Enhertu in combination with pertuzumab as a treatment for HER2 positive metastatic breast cancer. AstraZeneca also reported positive Phase III trial results for Saphnelo in systemic lupus erythematosus.
Intraday selling and high volatility amid mixed momentum signals
Momentum signals for AZN are mixed: the MACD on D1 reflects strong bullish momentum and the ADX confirms a firm trend, yet overbought conditions in Bull/Bear Power reveal intraday seller dominance. The RSI maintains a neutral to mildly bullish position, while the Stochastic RSI and CCI both point to neutral or oversold territory, highlighting ongoing market indecision. The Awesome Oscillator fails to confirm a clear trend direction, and today’s pronounced 3.67% decline—with no opening gap—brings the price close to the day’s low within a wide trading range, resulting in heightened volatility and persistent downside pressure despite conflicting daily and intraday technical readings.
Range-bound consolidation likely as upside breakout gains probability
Over the next five trading days, AZN is likely to fluctuate between GBX 12,700 and GBX 13,800, reflecting a typical volatility band relative to current levels. There is a high probability (over 80%) of an upward move, supported by weekly "Buy" or "Strong Buy" signals and positive readings from Moving Averages. In the baseline scenario, AZN consolidates within a sideways channel between GBX 13,000 and GBX 13,800. Should the price break above GBX 13,800, it could target the Ichimoku Kijun resistance at GBX 14,376.18, while a drop below GBX 13,000 would open the path toward support at GBX 12,700.
Last time, analysts noted that AstraZeneca PLC remains in a strong medium- and long-term bullish trend above key moving averages, with the current price near dynamic support despite a minor intraday decline. Momentum indicators such as MACD and ADX reinforce upside strength, while resistance is identified at the Ichimoku Kijun, and short-term oscillators present mildly overbought signals amid consolidation within a projected range.


Latest AstraZeneca News


-
 Afghanistan
-
 Albania
-
 Algeria
-
 Angola
-
 Argentina
-
 Armenia
-
 Australia
-
 Austria
-
 Azerbaijan
-
 Bahamas
-
 Bahrain
-
 Bangladesh
-
 Belarus
-
 Belgium
-
 Bolivia
-
 Botswana
-
 Brazil
-
 Brunei
-
 Bulgaria
-
 Cambodia
-
 Cameroon
-
 Canada
-
 Chile
Chile
-
 China
China
-
 Colombia
-
 Congo
Congo
-
 Costa Rica
-
 Cote d'Ivoire
-
 Croatia
-
 Cuba
Cuba
-
 Cyprus
-
 Czechia
-
 DR Congo
-
 Denmark
-
 Dominican Republic
-
 Ecuador
-
 Egypt
Egypt
-
 El Salvador
-
 Estonia
-
 Eswatini
-
 Ethiopia
-
 Finland
-
 France
-
 Georgia
-
 Germany
-
 Ghana
Ghana
-
 Greece
-
 Haiti
Haiti
-
 Hong Kong
-
 Hungary
-
 India
India
-
 Indonesia
-
 Iran, Islamic republic
-
 Iraq
Iraq
-
 Ireland
-
 Israel
-
 Italy
Italy
-
 Jamaica
-
 Japan
Japan
-
 Jordan
-
 Kazakhstan
-
 Kenya
Kenya
-
 Korea
Korea
-
 Kuwait
-
 Kyrgyzstan
-
 Laos
Laos
-
 Latvia
-
 Lebanon
-
 Lesotho
-
 Libya
Libya
-
 Lithuania
-
 Luxembourg
-
 Madagascar
-
 Malaysia
-
 Malta
Malta
-
 Mauritius
-
 Mexico
-
 Moldova
-
 Mongolia
-
 Montenegro
-
 Morocco
-
 Mozambique
-
 Myanmar
-
 Namibia
-
 Nepal
Nepal
-
 Netherlands
-
 New Zealand
-
 Nigeria
-
 North Macedonia
-
 Norway
-
 Oman
Oman
-
 Pakistan
-
 Palestine
-
 Panama
-
 Papua New Guinea
-
 Paraguay
-
 Peru
Peru
-
 Philippines
-
 Poland
-
 Portugal
-
 Puerto Rico
-
 Qatar
Qatar
-
 Reunion
-
 Romania
-
 Rwanda
-
 Saudi Arabia
-
 Serbia
-
 Singapore
-
 Slovakia
-
 Slovenia
-
 Somalia
-
 South Africa
-
 Spain
Spain
-
 Sri Lanka
-
 Sweden
-
 Switzerland
-
 Syria
Syria
-
 Taiwan
-
 Tajikistan
-
 Tanzania
-
 Thailand
-
 Trinidad and Tobago
-
 Tunisia
-
 Turkey
-
 UAE
UAE
-
 Uganda
-
 Ukraine
-
 United Kingdom
-
United States
-
 Uruguay
-
 Uzbekistan
-
 Venezuela
-
 Vietnam
-
 Yemen
Yemen
-
 Zambia
-
 Zimbabwe
- Forex
- Crypto
