
Affirm stock price forecast: bullish signals and institutional moves as AFRM gains 3.11%

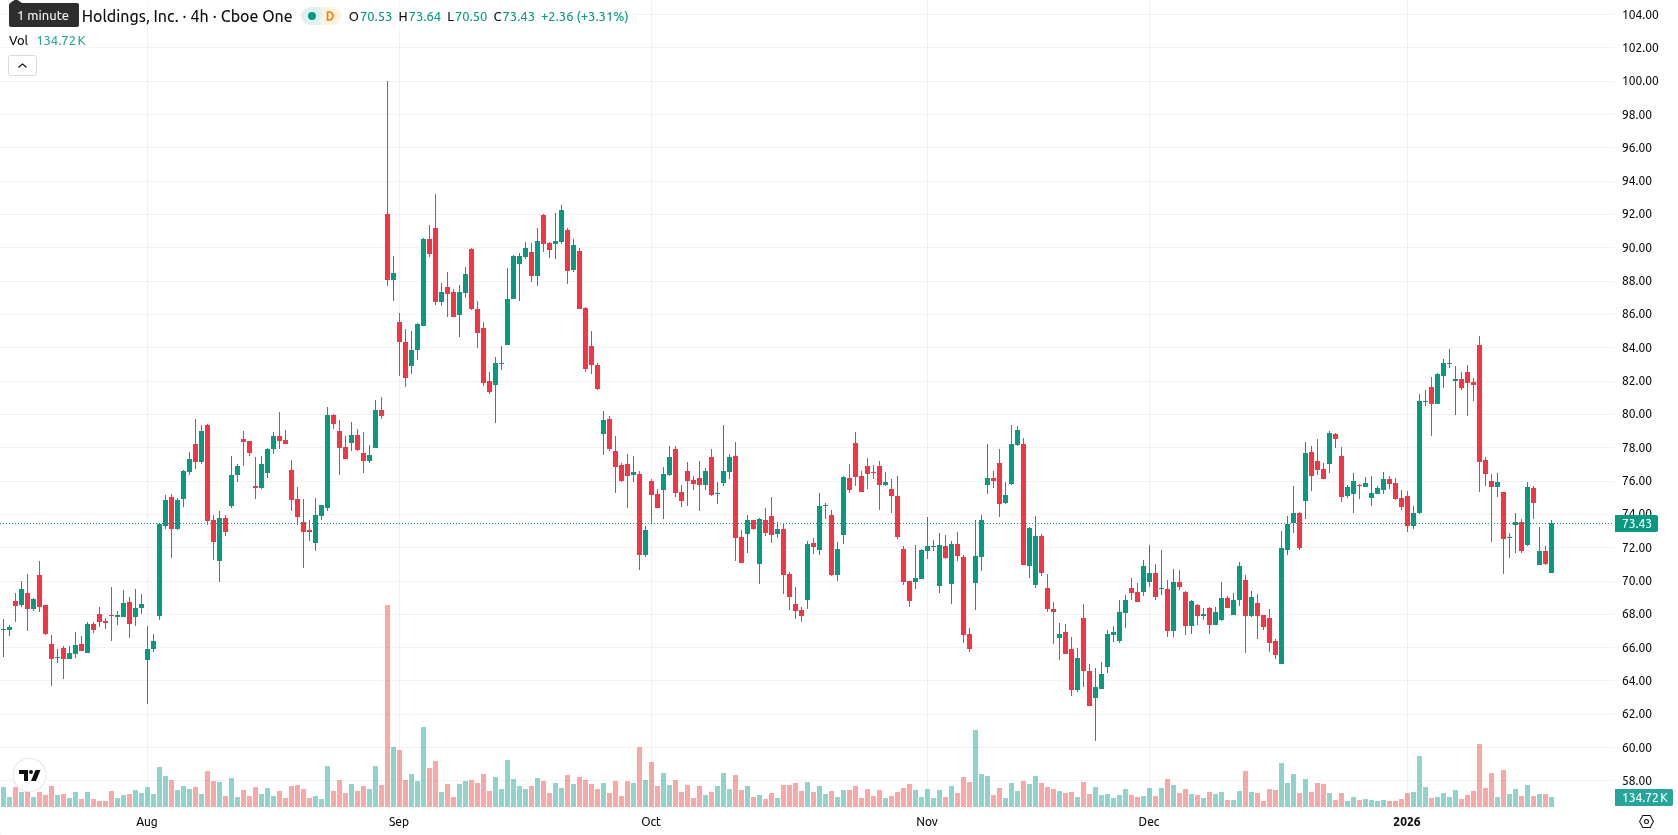
Affirm Holdings, Inc. (AFRM) is trading at $73.31, below both its MA-20 ($76.72) and MA-10, slightly above the MA-50 ($72.46), and well above the MA-200 ($67.62). This signals short- and medium-term weakness and resistance from sellers, while the long-term trend remains supportive, with the Ichimoku Kijun at $74.78 identified as the next dynamic resistance.
Highlights
- Affirm launched a buy now, pay later program for the housing sector, allowing tenants to split monthly rent into two installments via a partnership with Esusu.
- Nordea Investment Management AB significantly reduced its Affirm holdings in the third quarter, while Pacific Heights Asset Management LLC increased their stake.
- Affirm does not charge late fees, but warned that missed or late payments may negatively impact customers' credit, according to its website.
Institutional flows and new offering shift sentiment in rental market
Affirm expanded its offerings into the housing sector through a new buy now, pay later (BNPL) program, enabling tenants to split monthly rent into two equal installments via a partnership with Esusu. The company also reported significant changes in institutional investor positions, as Nordea Investment Management AB significantly reduced its holdings in the third quarter, while Pacific Heights Asset Management LLC increased their stake. Affirm has stated on its website that it does not charge late fees, but missed or late payments may affect customers' credit.
Muted momentum persists as oscillators approach oversold zone
Momentum on the daily chart is muted for AFRM: the MACD is neutral, and the ADX reflects a lack of clear directional strength. Multiple oscillators—including RSI (42.99), Stochastic RSI (oversold), and CCI (oversold at –126.23)—suggest the price is approaching oversold territory, but Bull/Bear Power remains firmly negative (–2.16), showing that sellers dominate intraday action. Despite a gap down at the open, AFRM is trading near today's high of $73.60, showing moderate volatility and a strong upward push after the open. However, the intraday tone remains cautious, as downside momentum from indicators diverges slightly from the upward price move.
Bullish breakout probable as volatility bands narrow
For the next five sessions, the typical volatility band is expected to range between $71.50 and $80.00, with the current price near the lower half of this window. There is a high probability (over 80%) of a price increase, reflecting consistently bullish weekly signals from Moving Averages, ADX, and MACD, while downside risk is low. The most likely scenario is sideways movement between support at $72.50 and resistance around $75.00; if AFRM maintains levels above $75.00, a bullish breakout could encourage renewed buying, while a drop below $72.00 may draw further selling, though this is less likely given present momentum.
Previously it was reported that Affirm Holdings, Inc. is trading just below its short-term moving average while holding above key medium- and long-term averages, indicating near-term selling pressure within an overall bullish trend. Momentum remains mixed, as a bullish MACD contrasts with weak trend signals and oversold oscillators, while dynamic support is noted at the Kijun line and immediate resistance at the short-term average.


Latest Affirm News


-
 Afghanistan
-
 Albania
-
 Algeria
-
 Angola
-
 Argentina
-
 Armenia
-
 Australia
-
 Austria
-
 Azerbaijan
-
 Bahamas
-
 Bahrain
-
 Bangladesh
-
 Belarus
-
 Belgium
-
 Bolivia
-
 Botswana
-
 Brazil
-
 Brunei
-
 Bulgaria
-
 Cambodia
-
 Cameroon
-
 Canada
-
 Chile
Chile
-
 China
China
-
 Colombia
-
 Congo
Congo
-
 Costa Rica
-
 Cote d'Ivoire
-
 Croatia
-
 Cuba
Cuba
-
 Cyprus
-
 Czechia
-
 DR Congo
-
 Denmark
-
 Dominican Republic
-
 Ecuador
-
 Egypt
Egypt
-
 El Salvador
-
 Estonia
-
 Eswatini
-
 Ethiopia
-
 Finland
-
 France
-
 Georgia
-
 Germany
-
 Ghana
Ghana
-
 Greece
-
 Haiti
Haiti
-
 Hong Kong
-
 Hungary
-
 India
India
-
 Indonesia
-
 Iran, Islamic republic
-
 Iraq
Iraq
-
 Ireland
-
 Israel
-
 Italy
Italy
-
 Jamaica
-
 Japan
Japan
-
 Jordan
-
 Kazakhstan
-
 Kenya
Kenya
-
 Korea
Korea
-
 Kuwait
-
 Kyrgyzstan
-
 Laos
Laos
-
 Latvia
-
 Lebanon
-
 Lesotho
-
 Libya
Libya
-
 Lithuania
-
 Luxembourg
-
 Madagascar
-
 Malaysia
-
 Malta
Malta
-
 Mauritius
-
 Mexico
-
 Moldova
-
 Mongolia
-
 Montenegro
-
 Morocco
-
 Mozambique
-
 Myanmar
-
 Namibia
-
 Nepal
Nepal
-
 Netherlands
-
 New Zealand
-
 Nigeria
-
 North Macedonia
-
 Norway
-
 Oman
Oman
-
 Pakistan
-
 Palestine
-
 Panama
-
 Papua New Guinea
-
 Paraguay
-
 Peru
Peru
-
 Philippines
-
 Poland
-
 Portugal
-
 Puerto Rico
-
 Qatar
Qatar
-
 Reunion
-
 Romania
-
 Rwanda
-
 Saudi Arabia
-
 Serbia
-
 Singapore
-
 Slovakia
-
 Slovenia
-
 Somalia
-
 South Africa
-
 Spain
Spain
-
 Sri Lanka
-
 Sweden
-
 Switzerland
-
 Syria
Syria
-
 Taiwan
-
 Tajikistan
-
 Tanzania
-
 Thailand
-
 Trinidad and Tobago
-
 Tunisia
-
 Turkey
-
 UAE
UAE
-
 Uganda
-
 Ukraine
-
 United Kingdom
-
United States
-
 Uruguay
-
 Uzbekistan
-
 Venezuela
-
 Vietnam
-
 Yemen
Yemen
-
 Zambia
-
 Zimbabwe
- Forex
- Crypto
