
Intraday volatility and technical divergence — Globalstar stock drops 4.02%

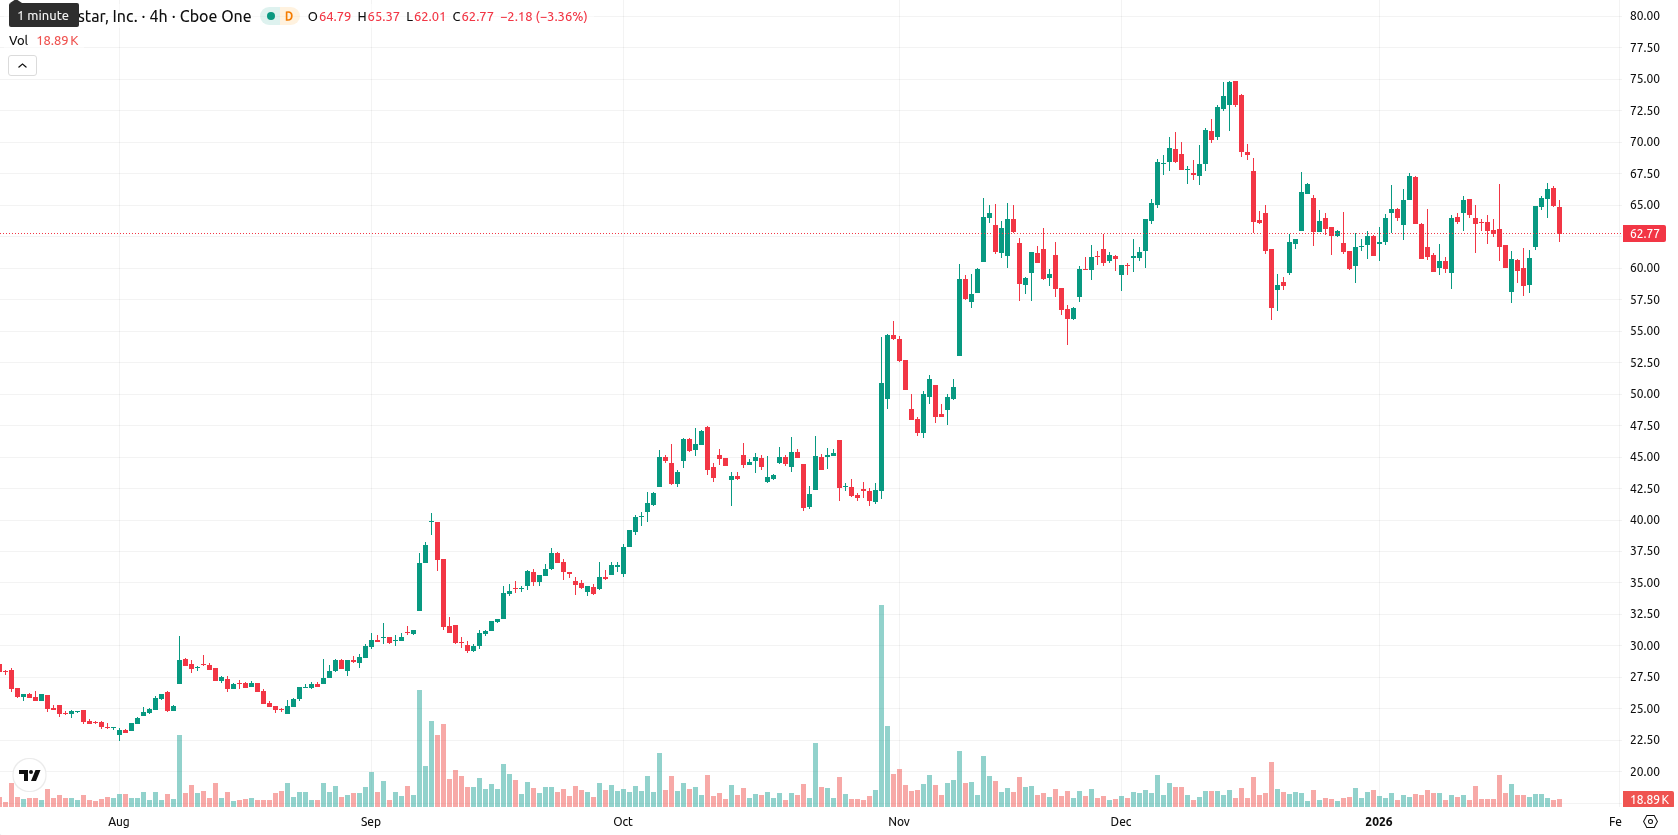
Globalstar, Inc. (GSAT) is trading at $62.36, just below the MA-20 at $62.54 and MA-50 at $63.07, while holding well above the MA-200 at $37.31. This setup signals some short-term softness, but the asset retains a strong medium- and long-term trend bias.
Highlights
- GSAT is trading at $62.36, just below its MA-20 ($62.54) and MA-50 ($63.07) but well above MA-200 ($37.31), indicating short-term caution amid a positive long-term trend.
- Momentum and oscillator signals are mixed—MACD signals Buy, ADX is Neutral, RSI is at 54.65 (Buy), while intraday overbought conditions and selling pressure persist.
- Key levels for the next five days are support at $62.31 (Ichimoku Kijun) and resistance at $63.07 (MA-50), with over 80% probability of a price increase within the $60.90–$63.59 range.
Buyer dominance wanes as volatility and oscillator divergence increase
Key technicals show GSAT maintaining support at the Ichimoku Kijun, which is currently at $62.31, with resistance defined by the MA-50 at $63.07. The MACD remains on Buy while the ADX reads Neutral, suggesting moderate trend strength; the RSI is at 54.65 (Buy) and the Commodity Channel Index is Overbought, with the Stochastic RSI on Neutral. Bull/Bear Power suggests an Overbought state, revealing recent buyer dominance. Still, strong selling pressure pushed the price down 4.02% intraday and GSAT is trading near the low of today’s range, highlighting significant intraday volatility and a divergence in short-term oscillators.
Sideways consolidation expected amid strong technical bias for gains
For the next five trading days, the anticipated price range is $60.90 to $63.59, which corresponds to a typical volatility band relative to current levels. Weekly indicators, including RSI-W1, ADX-W1, MACD-W1, and MA-50-W1, point to a very high probability — above 80% — of a price increase, with downside risk less likely. The baseline scenario is a sideways consolidation between $62.31 (Ichimoku Kijun support) and $63.07 (MA-50 resistance). A decisive move above $63.07 could prompt further upside, while a fall below $62.31 may test the lower part of the expected range near $60.90.
Previously it was reported that Globalstar Inc. is trading above its short- and long-term moving averages, reflecting strong ongoing momentum and positioning support as institutional investors add shares. However, while resistance remains near $65.33 and support at the 50-day moving average, technical indicators present mixed signals—with MACD and ADX bearish but oscillators suggesting oversold conditions—indicating a volatile and uncertain short-term outlook.


Latest Globalstar News


-
 Afghanistan
-
 Albania
-
 Algeria
-
 Angola
-
 Argentina
-
 Armenia
-
 Australia
-
 Austria
-
 Azerbaijan
-
 Bahamas
-
 Bahrain
-
 Bangladesh
-
 Belarus
-
 Belgium
-
 Bolivia
-
 Botswana
-
 Brazil
-
 Brunei
-
 Bulgaria
-
 Cambodia
-
 Cameroon
-
 Canada
-
 Chile
Chile
-
 China
China
-
 Colombia
-
 Congo
Congo
-
 Costa Rica
-
 Cote d'Ivoire
-
 Croatia
-
 Cuba
Cuba
-
 Cyprus
-
 Czechia
-
 DR Congo
-
 Denmark
-
 Dominican Republic
-
 Ecuador
-
 Egypt
Egypt
-
 El Salvador
-
 Estonia
-
 Eswatini
-
 Ethiopia
-
 Finland
-
 France
-
 Georgia
-
 Germany
-
 Ghana
Ghana
-
 Greece
-
 Haiti
Haiti
-
 Hong Kong
-
 Hungary
-
 India
India
-
 Indonesia
-
 Iran, Islamic republic
-
 Iraq
Iraq
-
 Ireland
-
 Israel
-
 Italy
Italy
-
 Jamaica
-
 Japan
Japan
-
 Jordan
-
 Kazakhstan
-
 Kenya
Kenya
-
 Korea
Korea
-
 Kuwait
-
 Kyrgyzstan
-
 Laos
Laos
-
 Latvia
-
 Lebanon
-
 Lesotho
-
 Libya
Libya
-
 Lithuania
-
 Luxembourg
-
 Madagascar
-
 Malaysia
-
 Malta
Malta
-
 Mauritius
-
 Mexico
-
 Moldova
-
 Mongolia
-
 Montenegro
-
 Morocco
-
 Mozambique
-
 Myanmar
-
 Namibia
-
 Nepal
Nepal
-
 Netherlands
-
 New Zealand
-
 Nigeria
-
 North Macedonia
-
 Norway
-
 Oman
Oman
-
 Pakistan
-
 Palestine
-
 Panama
-
 Papua New Guinea
-
 Paraguay
-
 Peru
Peru
-
 Philippines
-
 Poland
-
 Portugal
-
 Puerto Rico
-
 Qatar
Qatar
-
 Reunion
-
 Romania
-
 Rwanda
-
 Saudi Arabia
-
 Serbia
-
 Singapore
-
 Slovakia
-
 Slovenia
-
 Somalia
-
 South Africa
-
 Spain
Spain
-
 Sri Lanka
-
 Sweden
-
 Switzerland
-
 Syria
Syria
-
 Taiwan
-
 Tajikistan
-
 Tanzania
-
 Thailand
-
 Trinidad and Tobago
-
 Tunisia
-
 Turkey
-
 UAE
UAE
-
 Uganda
-
 Ukraine
-
 United Kingdom
-
United States
-
 Uruguay
-
 Uzbekistan
-
 Venezuela
-
 Vietnam
-
 Yemen
Yemen
-
 Zambia
-
 Zimbabwe
- Forex
- Crypto
