
+3.10% for Intel stock — technical signals suggest high probability of continued gains

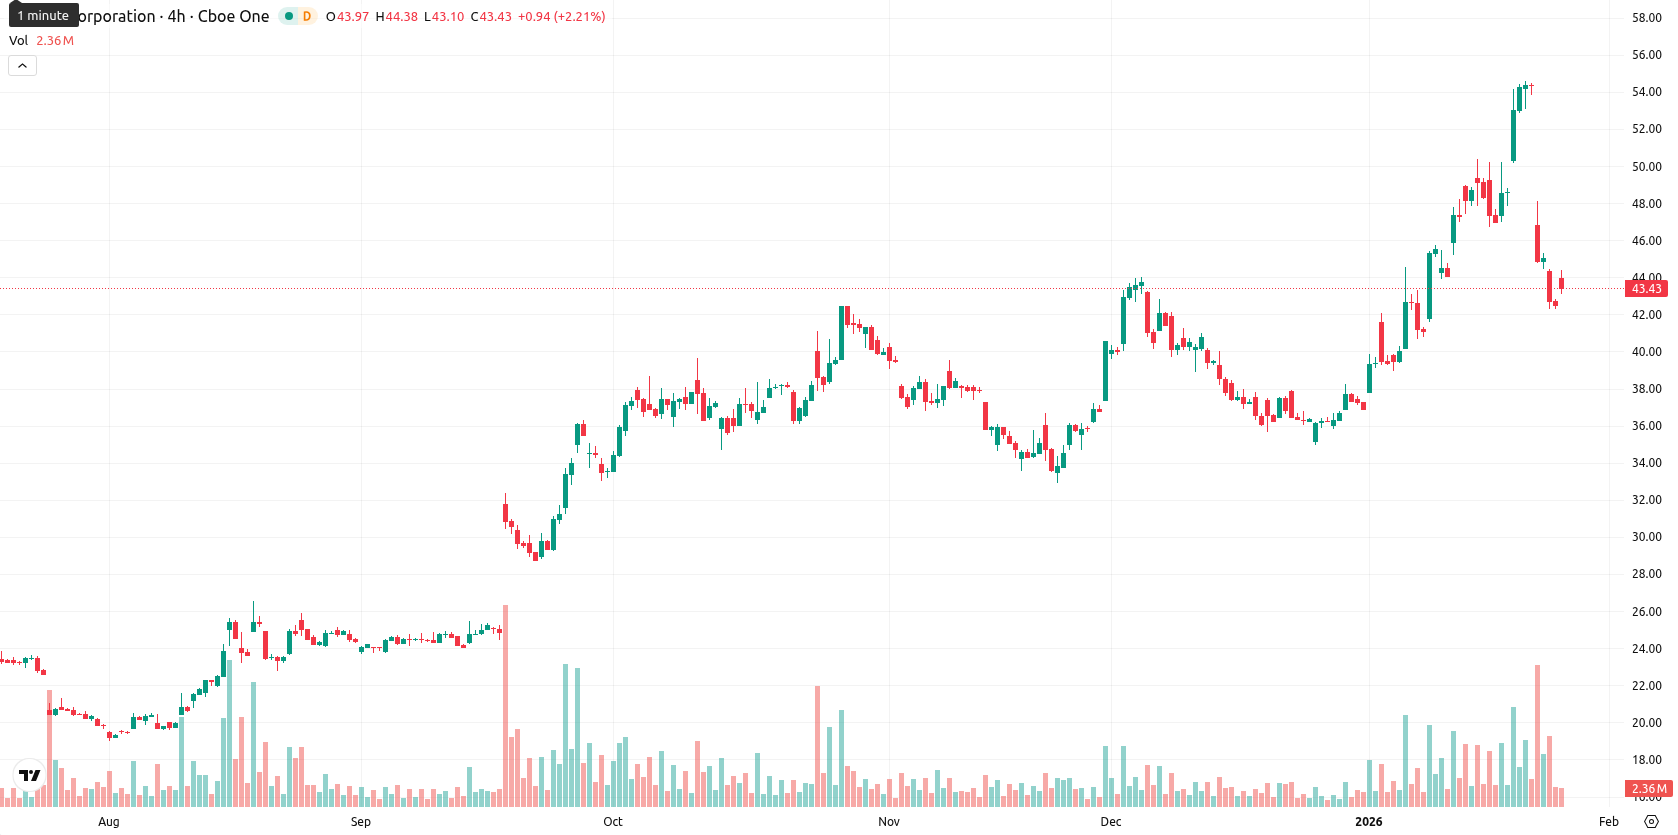
Intel Corporation (INTC) is trading at $43.84 after a daily increase of $1.32 or 3.10%. The current price is above the MA-20 ($43.77), MA-50 ($40.14), and MA-200 ($29.28), confirming a bullish structure on medium- and long-term timeframes, while the short-term trend is mixed with minor resistance.
Highlights
- Intel trades at $43.84, above the MA-20 ($43.77), MA-50 ($40.14), and MA-200 ($29.28), confirming a bullish medium- and long-term technical structure.
- Momentum signals are mixed: the daily MACD and ADX are bullish, but RSI is neutral and Stochastic RSI flags oversold conditions with sellers still active.
- Expected trading range for the next week is $43.40–$44.50, with key resistance at $44.78 (Ichimoku Kijun) and strong probability of price consolidation or upside.
Cautious outlook as upbeat earnings face weak guidance, state support
Intel reported fourth-quarter 2025 earnings that surpassed expectations, but commentary about weaker-than-expected guidance for the first quarter of 2026 led to cautious sentiment. The company continues to navigate supply chain challenges and competitive pressures in AI. In August 2025, the U.S. federal government acquired a nearly 10% stake, providing Intel with resources to expand its manufacturing capacity and prioritize advanced process ramp-ups.
Bullish momentum signals as mixed technical indicators cap upside
The nearest dynamic resistance is at the Ichimoku Kijun ($44.78), with support at the MA-20, and no active golden or death crosses are present. Momentum signals are mixed: the daily MACD gives a strong buy, supported by a bullish ADX. However, the RSI is neutral, and both the Stochastic RSI and Bull/Bear Power flag oversold conditions, indicating continuing selling activity.
High chance of breakout as bullish signals outweigh risk
For the next week, typical volatility for Intel is expected between $43.40 and $44.50. The probability of a price increase is high (over 80%), as weekly signals from the Moving Average, RSI, ADX, and MACD are bullish. The base case is consolidation within this range, while a bullish scenario could see a breakout through $44.78, and a bearish move below $43.40 would signal renewed selling.
Last time, analysts noted that Intel is experiencing short-term bearish pressure as it trades below its 20-day moving average, but remains above both its 50-day and 200-day moving averages, supporting a bullish medium- and long-term trend. Despite mixed oscillator signals and active selling pressure, immediate support is seen around $40 with resistance near $45, suggesting volatility persists as sellers currently dominate the intraday tone.


-
 Afghanistan
-
 Albania
-
 Algeria
-
 Angola
-
 Argentina
-
 Armenia
-
 Australia
-
 Austria
-
 Azerbaijan
-
 Bahamas
-
 Bahrain
-
 Bangladesh
-
 Belarus
-
 Belgium
-
 Bolivia
-
 Botswana
-
 Brazil
-
 Brunei
-
 Bulgaria
-
 Cambodia
-
 Cameroon
-
 Canada
-
 Chile
Chile
-
 China
China
-
 Colombia
-
 Congo
Congo
-
 Costa Rica
-
 Cote d'Ivoire
-
 Croatia
-
 Cuba
Cuba
-
 Cyprus
-
 Czechia
-
 DR Congo
-
 Denmark
-
 Dominican Republic
-
 Ecuador
-
 Egypt
Egypt
-
 El Salvador
-
 Estonia
-
 Eswatini
-
 Ethiopia
-
 Finland
-
 France
-
 Georgia
-
 Germany
-
 Ghana
Ghana
-
 Greece
-
 Haiti
Haiti
-
 Hong Kong
-
 Hungary
-
 India
India
-
 Indonesia
-
 Iran, Islamic republic
-
 Iraq
Iraq
-
 Ireland
-
 Israel
-
 Italy
Italy
-
 Jamaica
-
 Japan
Japan
-
 Jordan
-
 Kazakhstan
-
 Kenya
Kenya
-
 Korea
Korea
-
 Kuwait
-
 Kyrgyzstan
-
 Laos
Laos
-
 Latvia
-
 Lebanon
-
 Lesotho
-
 Libya
Libya
-
 Lithuania
-
 Luxembourg
-
 Madagascar
-
 Malaysia
-
 Malta
Malta
-
 Mauritius
-
 Mexico
-
 Moldova
-
 Mongolia
-
 Montenegro
-
 Morocco
-
 Mozambique
-
 Myanmar
-
 Namibia
-
 Nepal
Nepal
-
 Netherlands
-
 New Zealand
-
 Nigeria
-
 North Macedonia
-
 Norway
-
 Oman
Oman
-
 Pakistan
-
 Palestine
-
 Panama
-
 Papua New Guinea
-
 Paraguay
-
 Peru
Peru
-
 Philippines
-
 Poland
-
 Portugal
-
 Puerto Rico
-
 Qatar
Qatar
-
 Reunion
-
 Romania
-
 Rwanda
-
 Saudi Arabia
-
 Serbia
-
 Singapore
-
 Slovakia
-
 Slovenia
-
 Somalia
-
 South Africa
-
 Spain
Spain
-
 Sri Lanka
-
 Sweden
-
 Switzerland
-
 Syria
Syria
-
 Taiwan
-
 Tajikistan
-
 Tanzania
-
 Thailand
-
 Trinidad and Tobago
-
 Tunisia
-
 Turkey
-
 UAE
UAE
-
 Uganda
-
 Ukraine
-
 United Kingdom
-
United States
-
 Uruguay
-
 Uzbekistan
-
 Venezuela
-
 Vietnam
-
 Yemen
Yemen
-
 Zambia
-
 Zimbabwe
- Forex
- Crypto
