
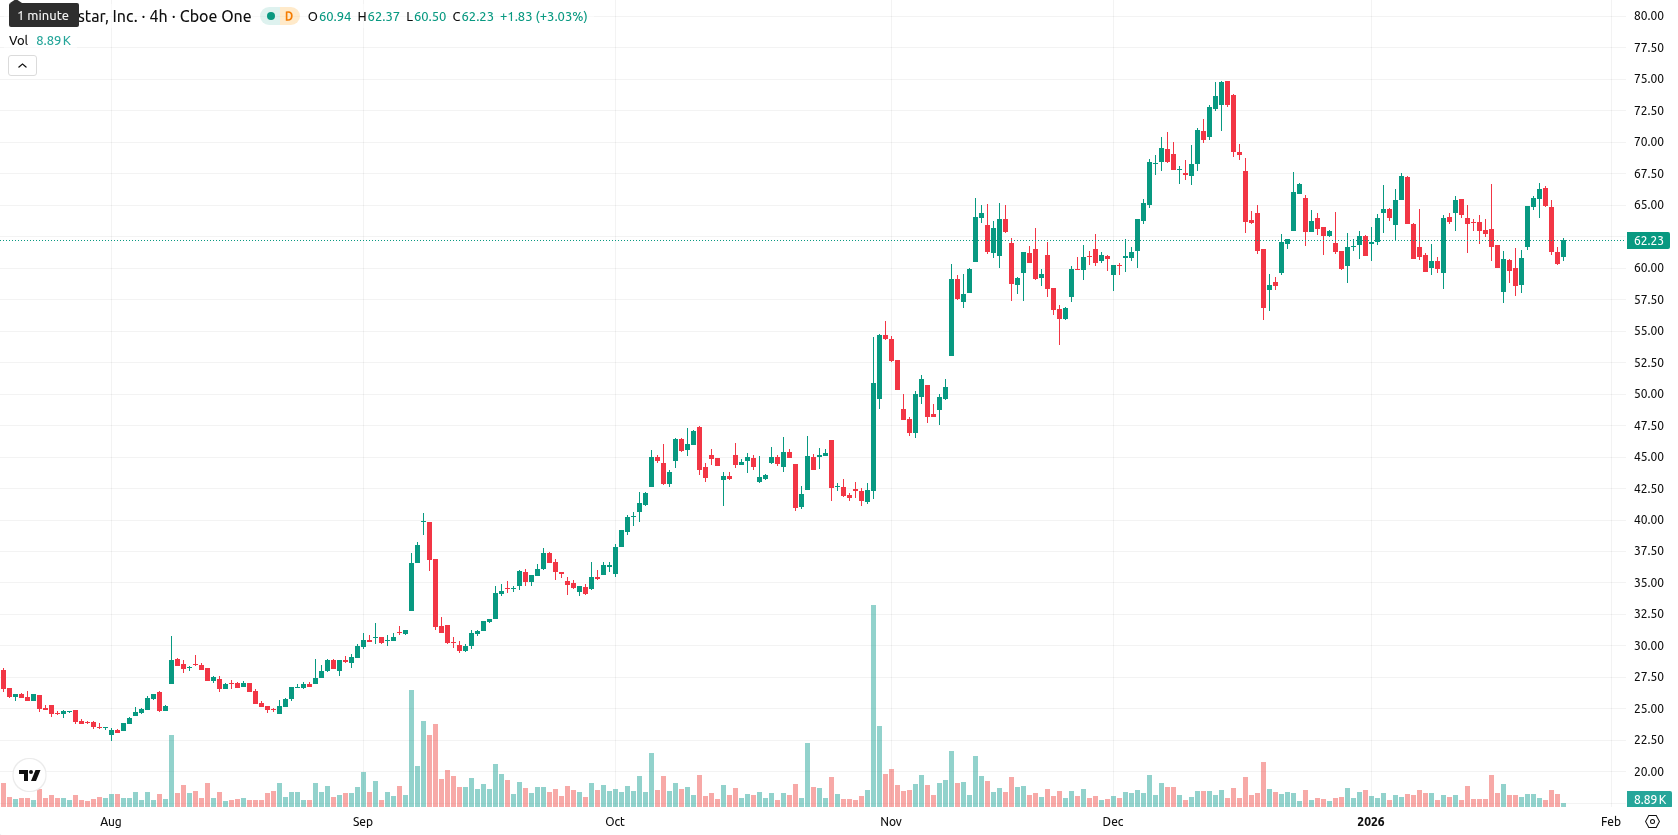
Globalstar stock price forecast: Sideways action expected as GSAT gains 3.15%

Globalstar, Inc. (GSAT) is trading at $62.30, just below the MA-20 ($62.40) and MA-50 ($63.08), while remaining well above the long-term MA-200 ($37.52). This positioning indicates short- and medium-term pressure from sellers, yet the overall long-term uptrend is intact.
Highlights
- GSAT is trading at $62.30, just below its MA-20 ($62.40) and MA-50 ($63.08), but remains well above its MA-200 ($37.52), signaling a strong long-term uptrend despite short- and medium-term selling pressure.
- Momentum indicators are mixed: daily MACD and ADX are neutral, while RSI (46.45) and Stochastic RSI (9.03) reflect short-term selling and oversold conditions, and intraday session strength contrasts with this cautious outlook.
- The projected five-session trading range is $59.00 to $64.50, with over 80% probability of an increase given decisive weekly bullish signals, and key levels at $61.71 (Kijun support) and $63.00–$64.50 (resistance).
Neutral momentum contrasts with fading bull strength at resistance
The nearest technical support lies at the Ichimoku Kijun level ($61.71), with resistance around the MA-50 and the $63.00 mark. Momentum signals are mixed: daily MACD and ADX remain neutral, while RSI at 46.45 and Stochastic RSI at 9.03 suggest short-term selling and oversold conditions, respectively; CCI is also neutral. Bull/Bear Power shows a strong overbought reading, highlighting prior buyer control but possibly fading, while the Awesome Oscillator is neutral. The stock’s session was marked by a $1.90 or 3.15% increase, moderate volatility, and strength toward the day’s highs, despite the mixed momentum outlook.
Upward bias prevails if breakout holds above trading band
For the next five sessions, GSAT is expected to trade within a typical volatility band between $59.00 and $64.50. The probability of a price increase is high, exceeding 80%, supported by bullish signals on the weekly chart from the Moving Averages, RSI, ADX, and MACD. The baseline scenario is continued sideways action within this range, but a sustained breakout above $64.50 could accelerate upward momentum. A close below $59.00 would increase selling pressure and could trigger a deeper pullback toward long-term support.
Previously it was reported that Globalstar Inc. is trading below its short- and medium-term moving averages while maintaining a strong position above the long-term average, indicating lingering short-term weakness within a bullish longer-term structure. Momentum and volatility signals are mixed, with mild bullishness from the MACD and moderately positive RSI contrasted by overbought oscillator readings, weak trend strength, and heightened intraday volatility, suggesting uncertainty and likely consolidation near current support and resistance levels.


Latest Globalstar News


-
 Afghanistan
-
 Albania
-
 Algeria
-
 Angola
-
 Argentina
-
 Armenia
-
 Australia
-
 Austria
-
 Azerbaijan
-
 Bahamas
-
 Bahrain
-
 Bangladesh
-
 Belarus
-
 Belgium
-
 Bolivia
-
 Botswana
-
 Brazil
-
 Brunei
-
 Bulgaria
-
 Cambodia
-
 Cameroon
-
 Canada
-
 Chile
Chile
-
 China
China
-
 Colombia
-
 Congo
Congo
-
 Costa Rica
-
 Cote d'Ivoire
-
 Croatia
-
 Cuba
Cuba
-
 Cyprus
-
 Czechia
-
 DR Congo
-
 Denmark
-
 Dominican Republic
-
 Ecuador
-
 Egypt
Egypt
-
 El Salvador
-
 Estonia
-
 Eswatini
-
 Ethiopia
-
 Finland
-
 France
-
 Georgia
-
 Germany
-
 Ghana
Ghana
-
 Greece
-
 Haiti
Haiti
-
 Hong Kong
-
 Hungary
-
 India
India
-
 Indonesia
-
 Iran, Islamic republic
-
 Iraq
Iraq
-
 Ireland
-
 Israel
-
 Italy
Italy
-
 Jamaica
-
 Japan
Japan
-
 Jordan
-
 Kazakhstan
-
 Kenya
Kenya
-
 Korea
Korea
-
 Kuwait
-
 Kyrgyzstan
-
 Laos
Laos
-
 Latvia
-
 Lebanon
-
 Lesotho
-
 Libya
Libya
-
 Lithuania
-
 Luxembourg
-
 Madagascar
-
 Malaysia
-
 Malta
Malta
-
 Mauritius
-
 Mexico
-
 Moldova
-
 Mongolia
-
 Montenegro
-
 Morocco
-
 Mozambique
-
 Myanmar
-
 Namibia
-
 Nepal
Nepal
-
 Netherlands
-
 New Zealand
-
 Nigeria
-
 North Macedonia
-
 Norway
-
 Oman
Oman
-
 Pakistan
-
 Palestine
-
 Panama
-
 Papua New Guinea
-
 Paraguay
-
 Peru
Peru
-
 Philippines
-
 Poland
-
 Portugal
-
 Puerto Rico
-
 Qatar
Qatar
-
 Reunion
-
 Romania
-
 Rwanda
-
 Saudi Arabia
-
 Serbia
-
 Singapore
-
 Slovakia
-
 Slovenia
-
 Somalia
-
 South Africa
-
 Spain
Spain
-
 Sri Lanka
-
 Sweden
-
 Switzerland
-
 Syria
Syria
-
 Taiwan
-
 Tajikistan
-
 Tanzania
-
 Thailand
-
 Trinidad and Tobago
-
 Tunisia
-
 Turkey
-
 UAE
UAE
-
 Uganda
-
 Ukraine
-
 United Kingdom
-
United States
-
 Uruguay
-
 Uzbekistan
-
 Venezuela
-
 Vietnam
-
 Yemen
Yemen
-
 Zambia
-
 Zimbabwe
- Forex
- Crypto
