
Intel stock: AI investment boost and revenue beat see shares decline 3.42% after mixed signals

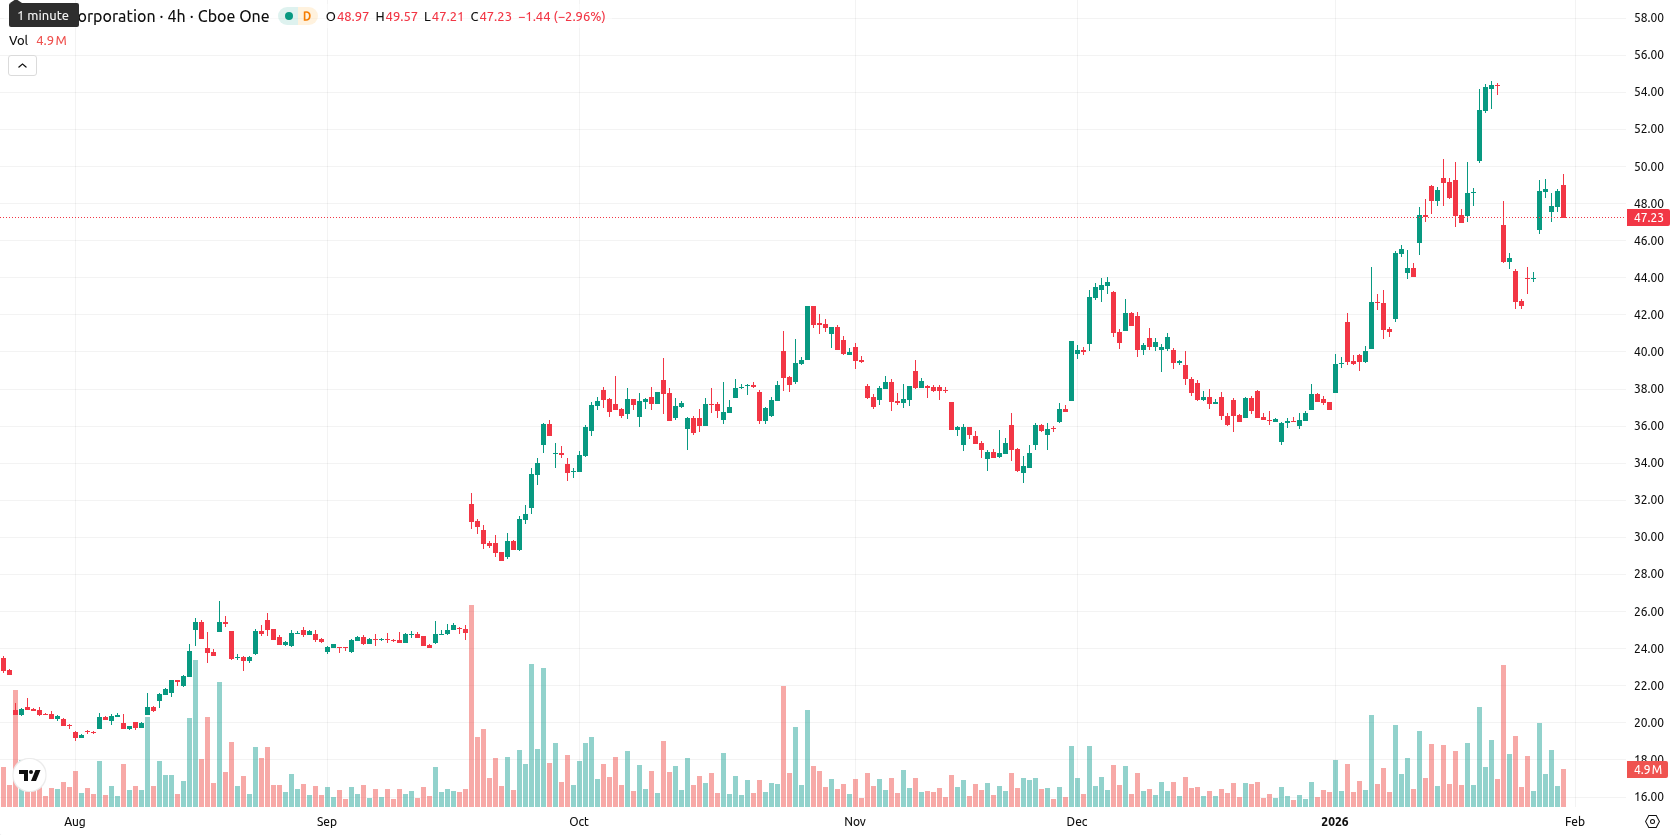
Intel Corporation (INTC) is trading at $47.00 after slipping 3.42% on the session, positioning itself well above the MA-20 ($45.33), MA-50 ($40.78), and MA-200 ($29.68) levels. This configuration underscores bullish momentum across all timeframes, with the price currently hugging the lower end of today's volatile $47.48 – $49.57 range.
Highlights
- Intel reported Q4 revenue of $13.7 billion and non-GAAP EPS of $0.15, but cautious Q1 guidance and supply chain issues pressured shares.
- The company secured $8.9 billion in U.S. government funds for domestic AI chip production, plus a $5 billion Nvidia investment and closed 2023 with $37.4 billion in liquidity.
- Intel shares trade at $47.00, above MA-20 ($45.33) and MA-50 ($40.78), with bullish weekly indicators suggesting an 80%+ probability of further price increases toward $49.75.
Cautious outlook weighs on shares despite revenue beat, funding boosts
Intel reported stronger-than-expected quarterly revenue of $13.7 billion, a non-GAAP gross margin of 37.9%, and earnings per share of $0.15, but shares saw pressure due to cautious first quarter guidance and ongoing supply chain challenges. Recently, the company received $8.9 billion from the U.S. government to bolster domestic AI chip production, further supported by substantial strategic investments, including a $5 billion infusion from Nvidia after regulatory clearance in January 2026. These actions, combined with asset sales and other funding initiatives such as SoftBank's participation, strengthened Intel's balance sheet, which closed the year with $37.4 billion in cash and short-term investments.
Technical buyers dominate as momentum remains positive but mixed signals arise
Technically, the bullish structure is confirmed by prices holding above all major moving averages, with dynamic support at the Ichimoku Kijun ($44.78) and resistance levels shifting toward $48 – $49. Momentum remains positive: MACD and ADX point to healthy upside, while RSI (57.80) and CCI (51.69) suggest a neutral-to-bullish bias. The Stochastic RSI is mid-range and does not show clear overbought/oversold conditions. On D1, Bull/Bear Power is overbought, showing recent buyer strength, though intraday signals suggest mixed short-term direction and some exhaustion risk.
Upside bias holds as volatility band defines near-term breakout risks
Looking ahead, INTC is likely to trade within a $46.00 – $49.75 volatility band relative to current levels as momentum consolidates after recent swings. With more than an 80% probability of continuation to the upside — as confirmed by weekly RSI, ADX, MACD, and the key moving averages — any sustained break above $49.75 could trigger further gains and challenge higher resistance. Conversely, a move below $46.00 would suggest a pullback toward the $45 support area in the near term.
Last time, analysts noted that Intel was consolidating above key rising moving averages, with the stock holding above medium-term EMAs and RSI readings showing healthy momentum without overbought conditions. Current price action reflects higher lows and resistance near $50, indicating a mild bullish bias within a defined range, with key support at $47 and $44.


Latest Intel News


-
 Afghanistan
-
 Albania
-
 Algeria
-
 Angola
-
 Argentina
-
 Armenia
-
 Australia
-
 Austria
-
 Azerbaijan
-
 Bahamas
-
 Bahrain
-
 Bangladesh
-
 Belarus
-
 Belgium
-
 Bolivia
-
 Botswana
-
 Brazil
-
 Brunei
-
 Bulgaria
-
 Cambodia
-
 Cameroon
-
 Canada
-
 Chile
Chile
-
 China
China
-
 Colombia
-
 Congo
Congo
-
 Costa Rica
-
 Cote d'Ivoire
-
 Croatia
-
 Cuba
Cuba
-
 Cyprus
-
 Czechia
-
 DR Congo
-
 Denmark
-
 Dominican Republic
-
 Ecuador
-
 Egypt
Egypt
-
 El Salvador
-
 Estonia
-
 Eswatini
-
 Ethiopia
-
 Finland
-
 France
-
 Georgia
-
 Germany
-
 Ghana
Ghana
-
 Greece
-
 Haiti
Haiti
-
 Hong Kong
-
 Hungary
-
 India
India
-
 Indonesia
-
 Iran, Islamic republic
-
 Iraq
Iraq
-
 Ireland
-
 Israel
-
 Italy
Italy
-
 Jamaica
-
 Japan
Japan
-
 Jordan
-
 Kazakhstan
-
 Kenya
Kenya
-
 Korea
Korea
-
 Kuwait
-
 Kyrgyzstan
-
 Laos
Laos
-
 Latvia
-
 Lebanon
-
 Lesotho
-
 Libya
Libya
-
 Lithuania
-
 Luxembourg
-
 Madagascar
-
 Malaysia
-
 Malta
Malta
-
 Mauritius
-
 Mexico
-
 Moldova
-
 Mongolia
-
 Montenegro
-
 Morocco
-
 Mozambique
-
 Myanmar
-
 Namibia
-
 Nepal
Nepal
-
 Netherlands
-
 New Zealand
-
 Nigeria
-
 North Macedonia
-
 Norway
-
 Oman
Oman
-
 Pakistan
-
 Palestine
-
 Panama
-
 Papua New Guinea
-
 Paraguay
-
 Peru
Peru
-
 Philippines
-
 Poland
-
 Portugal
-
 Puerto Rico
-
 Qatar
Qatar
-
 Reunion
-
 Romania
-
 Rwanda
-
 Saudi Arabia
-
 Serbia
-
 Singapore
-
 Slovakia
-
 Slovenia
-
 Somalia
-
 South Africa
-
 Spain
Spain
-
 Sri Lanka
-
 Sweden
-
 Switzerland
-
 Syria
Syria
-
 Taiwan
-
 Tajikistan
-
 Tanzania
-
 Thailand
-
 Trinidad and Tobago
-
 Tunisia
-
 Turkey
-
 UAE
UAE
-
 Uganda
-
 Ukraine
-
 United Kingdom
-
United States
-
 Uruguay
-
 Uzbekistan
-
 Venezuela
-
 Vietnam
-
 Yemen
Yemen
-
 Zambia
-
 Zimbabwe
- Forex
- Crypto
