
Bullish technicals and earnings anticipation — AMD stock gains 3.06%

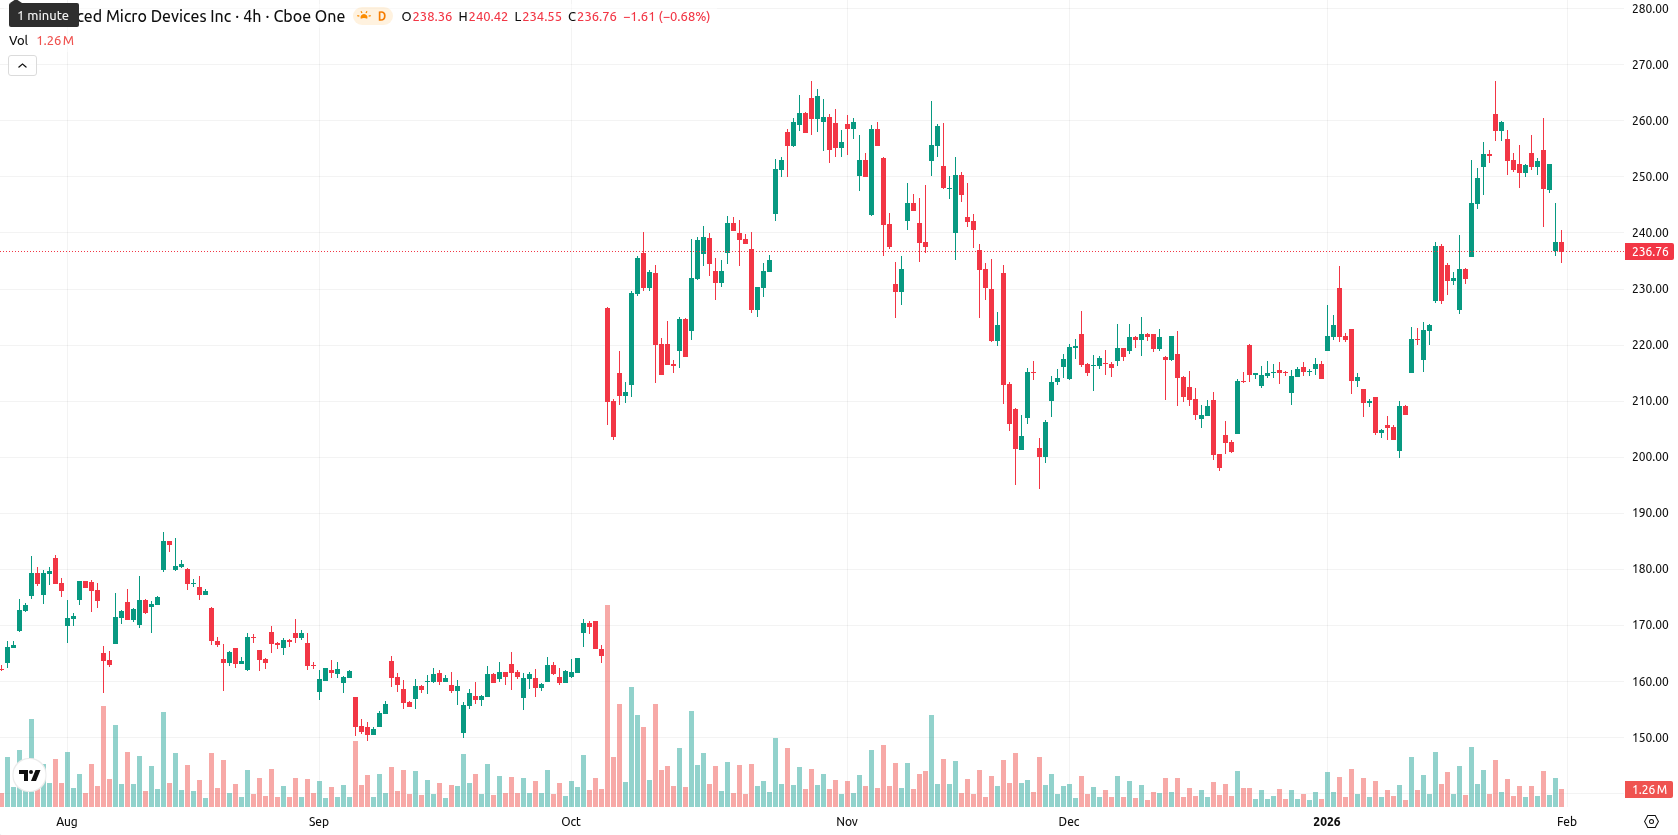
Advanced Micro Devices, Inc. (AMD) is trading at $243.98, above its MA-20 at $231.44, MA-50 at $221.25, and MA-200 at $175.80, confirming bullish momentum across short, medium, and long-term trends. The next dynamic support lies near the Ichimoku Kijun at $233.35, while MA-50 now acts as underlying support, with $250 as the next psychological resistance.
Highlights
- AMD reports quarterly earnings Tuesday after-market, with investor focus on data center business updates and AI product advancements amid recent share price declines.
- Supply chain developments and product pricing shifts will be closely monitored for operational or financial impact during the upcoming earnings release.
- AMD trades at $243.98 above MA-20, MA-50, and MA-200, with support at $233.35 and $250 as psychological resistance, confirming bullish momentum.
Earnings focus intensifies as investors eye data center, AI updates
AMD is set to report its quarterly earnings on Tuesday after the market closes, with investor focus centered on updates from the data center business and advancements in artificial intelligence products. The upcoming report will also cover recent supply chain developments and shifts in product pricing, areas of strong interest given recent share price declines. Market attention is heightened for any significant operational or financial updates as the company prepares its earnings release.
Momentum robust despite overbought signals and intraday volatility
Momentum indicators show a positive bias, with MACD suggesting a firm buy on both daily and weekly frames and ADX on D1 remaining neutral but supportive on W1. RSI and Stochastic RSI are overall neutral, with CCI holding steady and Bull/Bear Power showing an overbought condition, indicating recent dominance by buyers. The daily change is up 3.06% with an opening gap down (open below previous close) and a last trade near the high of the session, reflecting moderate intraday volatility and strength toward highs. While daily momentum is robust, some oscillators point to overbought zones, underscoring a divergence between upward momentum and potential mean reversion signals.
Upside favored as volatility narrows and breakout risks build
For the coming week, AMD is expected to trade within a typical volatility band of $234.00 to $250.00 based on current levels and market dynamics. There is a very high probability (more than 80%) of a price increase, while the likelihood of a decline is very low. In the baseline scenario, AMD consolidates between $234 and $250. A bullish breakout above $250 would open the way for further upside, while a bearish move below $234 could trigger a correction toward the lower $230 area.
Last time, analysts noted that AMD was trading above all key moving averages, indicating a bullish trend across timeframes despite a recent session marked by increased volatility and a gap down at the open. Technical momentum remains mixed, with a bullish MACD contrasting against high RSI and CCI reflecting overbought conditions, while short-term oscillators and weak trend signals suggest potential for near-term consolidation around support at $235 and resistance near $240.


Latest AMD News


-
 Afghanistan
-
 Albania
-
 Algeria
-
 Angola
-
 Argentina
-
 Armenia
-
 Australia
-
 Austria
-
 Azerbaijan
-
 Bahamas
-
 Bahrain
-
 Bangladesh
-
 Belarus
-
 Belgium
-
 Bolivia
-
 Botswana
-
 Brazil
-
 Brunei
-
 Bulgaria
-
 Cambodia
-
 Cameroon
-
 Canada
-
 Chile
Chile
-
 China
China
-
 Colombia
-
 Congo
Congo
-
 Costa Rica
-
 Cote d'Ivoire
-
 Croatia
-
 Cuba
Cuba
-
 Cyprus
-
 Czechia
-
 DR Congo
-
 Denmark
-
 Dominican Republic
-
 Ecuador
-
 Egypt
Egypt
-
 El Salvador
-
 Estonia
-
 Eswatini
-
 Ethiopia
-
 Finland
-
 France
-
 Georgia
-
 Germany
-
 Ghana
Ghana
-
 Greece
-
 Haiti
Haiti
-
 Hong Kong
-
 Hungary
-
 India
India
-
 Indonesia
-
 Iran, Islamic republic
-
 Iraq
Iraq
-
 Ireland
-
 Israel
-
 Italy
Italy
-
 Jamaica
-
 Japan
Japan
-
 Jordan
-
 Kazakhstan
-
 Kenya
Kenya
-
 Korea
Korea
-
 Kuwait
-
 Kyrgyzstan
-
 Laos
Laos
-
 Latvia
-
 Lebanon
-
 Lesotho
-
 Libya
Libya
-
 Lithuania
-
 Luxembourg
-
 Madagascar
-
 Malaysia
-
 Malta
Malta
-
 Mauritius
-
 Mexico
-
 Moldova
-
 Mongolia
-
 Montenegro
-
 Morocco
-
 Mozambique
-
 Myanmar
-
 Namibia
-
 Nepal
Nepal
-
 Netherlands
-
 New Zealand
-
 Nigeria
-
 North Macedonia
-
 Norway
-
 Oman
Oman
-
 Pakistan
-
 Palestine
-
 Panama
-
 Papua New Guinea
-
 Paraguay
-
 Peru
Peru
-
 Philippines
-
 Poland
-
 Portugal
-
 Puerto Rico
-
 Qatar
Qatar
-
 Reunion
-
 Romania
-
 Rwanda
-
 Saudi Arabia
-
 Serbia
-
 Singapore
-
 Slovakia
-
 Slovenia
-
 Somalia
-
 South Africa
-
 Spain
Spain
-
 Sri Lanka
-
 Sweden
-
 Switzerland
-
 Syria
Syria
-
 Taiwan
-
 Tajikistan
-
 Tanzania
-
 Thailand
-
 Trinidad and Tobago
-
 Tunisia
-
 Turkey
-
 UAE
UAE
-
 Uganda
-
 Ukraine
-
 United Kingdom
-
United States
-
 Uruguay
-
 Uzbekistan
-
 Venezuela
-
 Vietnam
-
 Yemen
Yemen
-
 Zambia
-
 Zimbabwe
- Forex
- Crypto
