
Bearish momentum and oversold signals weigh — Strategy stock drops 3.07%

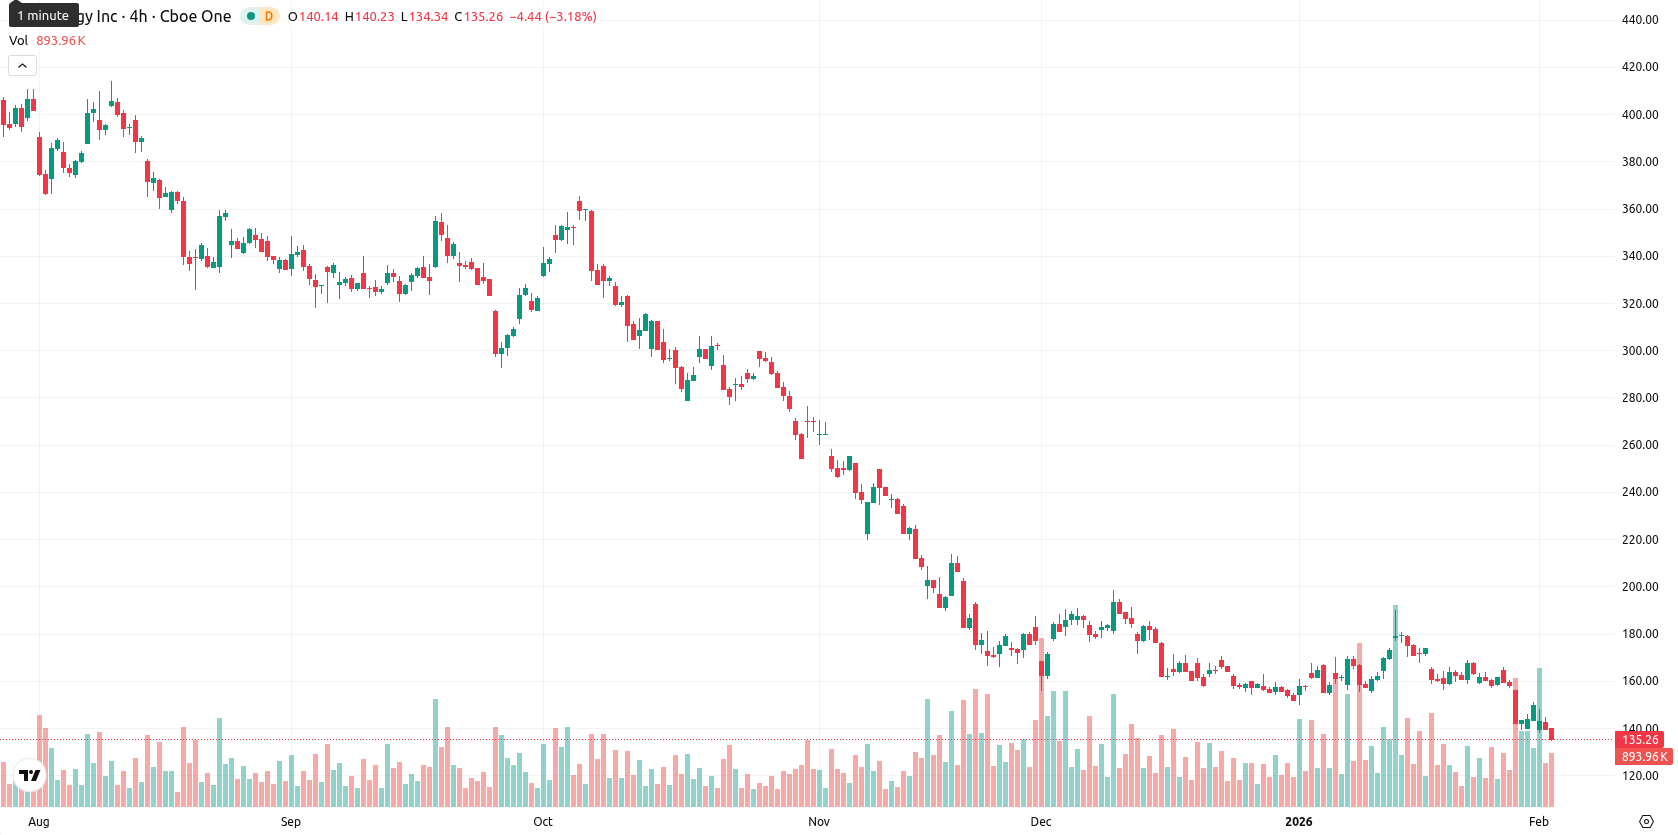
Strategy Incorporated (MSTR, formerly MicroStrategy) is trading well below its MA-20 at $161.46, MA-50 at $167.27, and MA-200 at $306.29, which signals strong selling pressure across all timeframes. Today's session saw a 3.07% decline with the price closing near the day's low of $134.39, highlighting pronounced selling after a volatile open.
Highlights
- Strategy acquired 855 bitcoins for $75.3 million, increasing its total holdings to 713,502 BTC at a $76,052 average cost per bitcoin.
- The purchase was funded by selling 673,527 common shares for $106.1 million, causing marginal per-share Bitcoin dilution, and an 11.25% preferred dividend starts February 2026.
- MSTR remains under strong selling pressure, trading below all major moving averages with a bearish bias; key support stands at $132.00 and resistance at $142.00–$144.00.
Equity funding and bitcoin expansion dilute per-share exposure
Strategy recently expanded its Bitcoin holdings with the purchase of 855 bitcoins for about $75.3 million, raising its total to 713,502 BTC at an average price of $76,052 per bitcoin. This acquisition was funded through the sale of 673,527 common shares, generating $106.1 million in net proceeds, while the ongoing equity raises have marginally diluted Bitcoin ownership per share. The company also announced an 11.25% dividend rate on Series A Perpetual Stretch Preferred Stock effective February 2026 and a $0.9375 per-share dividend payout for February, classified as a non-taxable return of capital in the U.S.
Bearish momentum intensifies as oscillators flag oversold exhaustion
Momentum remains bearish, with both the MACD and ADX indicating persistent downward pressure. Oversold signals dominate as the RSI sits at 35.47, Commodity Channel Index registers –223.79, and Stochastic RSI is deeply oversold, reflecting broad selling exhaustion. Bull/Bear Power is also sharply negative at –8.25, confirming that sellers control intraday momentum. The Awesome Oscillator supports this bearish tone. There is no notable divergence between oscillators and momentum; intraday losses are in line with prevailing downside momentum. The closest dynamic resistance is at the Ichimoku Kijun level of $164.35, with immediate support near recent intraday lows.
Downward bias persists as technical signals minimize rebound odds
For the next five days, the expected price range is $132.00 to $142.00, reflecting typical volatility around current levels. There is a very high probability, above 80%, that prices will continue to slide due to the fully bearish signals from all major weekly indicators, including Moving Averages, RSI, ADX, and MACD, with very limited chance of a rebound. MSTR is likely to consolidate between $132.00 and $142.00; a sustained move above the $142.00–$144.00 zone would be required to trigger a bullish shift. If prices break below $132.00, further downside risks are likely to emerge.
Last time, analysts noted that MSTR continues to trade well below key moving averages and is experiencing strong bearish momentum, with technical indicators such as RSI MACD and ADX confirming a persistent downtrend and oversold conditions. Sideways movement within a defined range is expected, as dynamic resistance remains significant and the probability of a near-term rebound remains low amid sustained selling pressure.


-
 Afghanistan
-
 Albania
-
 Algeria
-
 Angola
-
 Argentina
-
 Armenia
-
 Australia
-
 Austria
-
 Azerbaijan
-
 Bahamas
-
 Bahrain
-
 Bangladesh
-
 Belarus
-
 Belgium
-
 Bolivia
-
 Botswana
-
 Brazil
-
 Brunei
-
 Bulgaria
-
 Cambodia
-
 Cameroon
-
 Canada
-
 Chile
Chile
-
 China
China
-
 Colombia
-
 Congo
Congo
-
 Costa Rica
-
 Cote d'Ivoire
-
 Croatia
-
 Cuba
Cuba
-
 Cyprus
-
 Czechia
-
 DR Congo
-
 Denmark
-
 Dominican Republic
-
 Ecuador
-
 Egypt
Egypt
-
 El Salvador
-
 Estonia
-
 Eswatini
-
 Ethiopia
-
 Finland
-
 France
-
 Georgia
-
 Germany
-
 Ghana
Ghana
-
 Greece
-
 Haiti
Haiti
-
 Hong Kong
-
 Hungary
-
 India
India
-
 Indonesia
-
 Iran, Islamic republic
-
 Iraq
Iraq
-
 Ireland
-
 Israel
-
 Italy
Italy
-
 Jamaica
-
 Japan
Japan
-
 Jordan
-
 Kazakhstan
-
 Kenya
Kenya
-
 Korea
Korea
-
 Kuwait
-
 Kyrgyzstan
-
 Laos
Laos
-
 Latvia
-
 Lebanon
-
 Lesotho
-
 Libya
Libya
-
 Lithuania
-
 Luxembourg
-
 Madagascar
-
 Malaysia
-
 Malta
Malta
-
 Mauritius
-
 Mexico
-
 Moldova
-
 Mongolia
-
 Montenegro
-
 Morocco
-
 Mozambique
-
 Myanmar
-
 Namibia
-
 Nepal
Nepal
-
 Netherlands
-
 New Zealand
-
 Nigeria
-
 North Macedonia
-
 Norway
-
 Oman
Oman
-
 Pakistan
-
 Palestine
-
 Panama
-
 Papua New Guinea
-
 Paraguay
-
 Peru
Peru
-
 Philippines
-
 Poland
-
 Portugal
-
 Puerto Rico
-
 Qatar
Qatar
-
 Reunion
-
 Romania
-
 Rwanda
-
 Saudi Arabia
-
 Serbia
-
 Singapore
-
 Slovakia
-
 Slovenia
-
 Somalia
-
 South Africa
-
 Spain
Spain
-
 Sri Lanka
-
 Sweden
-
 Switzerland
-
 Syria
Syria
-
 Taiwan
-
 Tajikistan
-
 Tanzania
-
 Thailand
-
 Trinidad and Tobago
-
 Tunisia
-
 Turkey
-
 UAE
UAE
-
 Uganda
-
 Ukraine
-
 United Kingdom
-
United States
-
 Uruguay
-
 Uzbekistan
-
 Venezuela
-
 Vietnam
-
 Yemen
Yemen
-
 Zambia
-
 Zimbabwe
- Forex
- Crypto
