
META weekly review: sideways movement likely — watch $685 support and $710 resistance

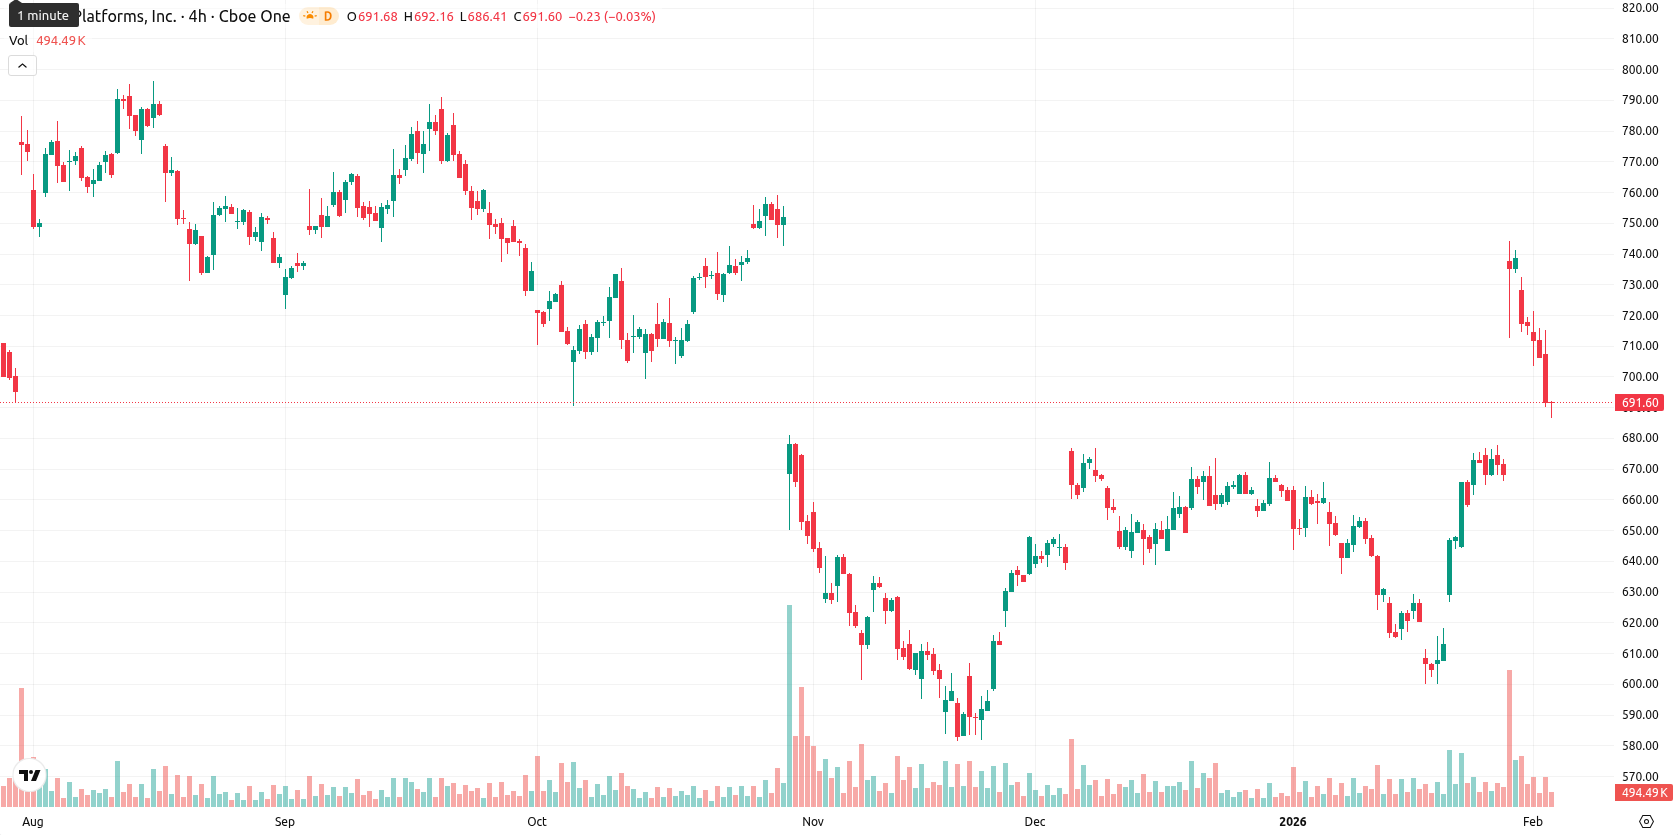
Meta Platforms, Inc. (META, formerly Facebook, Inc.) closed the week at $691.61, posting a decrease of $14.80 or 2.10% over the past seven days. The asset remains positioned above its weekly MA-20 ($656.47), MA-50 ($652.13), and MA-200 ($683.30), reaffirming the strength of the bullish trend across all major timeframes.
Highlights
- Meta trades at $691.61, remaining above the MA-20 ($656.47), MA-50 ($652.13), and MA-200 ($683.30), confirming bullish momentum across all timeframes.
- Momentum indicators show mixed signals: MACD and RSI suggest continued buy strength, but ADX and Bull/Bear Power highlight neutral or overbought conditions and possible buyer exhaustion.
- For the next five days, Meta is expected to range between $685 and $710, with a greater than 80% probability of price increase, but short-term weakness could trigger a shallow retracement.
Earnings beat and AI spending lift sentiment amid portfolio shifts
Meta reported strong Q4 and full-year 2025 earnings, with revenue reaching $59.89 billion, up 24% year-over-year, and net income of $22.77 billion. The company provided robust revenue guidance for the first quarter of 2026 and announced a significant increase in planned capital expenditures, with $115–$135 billion dedicated to AI infrastructure and data centers in 2026. Meta also declared a quarterly dividend of $0.525 per share and saw notable institutional activity as investment firms adjusted their holdings.
Upward momentum holds as technical indicators signal near-term fatigue
On the weekly chart, Meta continues to trade above its MA-20, MA-50, and MA-200, reinforcing upward momentum in the broader trend. Dynamic support is established by the Ichimoku Kijun at $672.00, with resistance focused near the psychological $700 level. Weekly RSI remains in bullish territory, while other indicators such as the CCI confirm upward bias, but there are emerging signs of potential exhaustion as the Bull/Bear Power is overbought and the Stochastic RSI is neutral. The ADX reflects moderate trend strength, suggesting momentum may be pausing but not reversing.
Sideways movement favored as breakout and retracement risks rise next week
For the next five to seven trading days, the technical outlook expects Meta to fluctuate between support at $685 and resistance at $710. Continuation of the sideways movement is most probable, although a bullish breakout above $710 could open the way for new highs, given strong signals from the moving averages and Ichimoku Kijun. Should price slip below $685, a deeper pullback is possible, but the underlying weekly trend suggests any dip will likely attract renewed buying.
Previously it was reported that Meta Platforms is trading firmly above major moving averages, supported by a robust bullish trend and positive momentum signals such as a MACD buy reading, though multiple oscillators highlight overbought conditions and a neutral ADX suggests trend exhaustion. Short-term technicals indicate resistance near $720 and support at $705–$670, pointing to a likely sideways consolidation as markets digest recent gains.


-
 Afghanistan
-
 Albania
-
 Algeria
-
 Angola
-
 Argentina
-
 Armenia
-
 Australia
-
 Austria
-
 Azerbaijan
-
 Bahamas
-
 Bahrain
-
 Bangladesh
-
 Belarus
-
 Belgium
-
 Bolivia
-
 Botswana
-
 Brazil
-
 Brunei
-
 Bulgaria
-
 Cambodia
-
 Cameroon
-
 Canada
-
 Chile
Chile
-
 China
China
-
 Colombia
-
 Congo
Congo
-
 Costa Rica
-
 Cote d'Ivoire
-
 Croatia
-
 Cuba
Cuba
-
 Cyprus
-
 Czechia
-
 DR Congo
-
 Denmark
-
 Dominican Republic
-
 Ecuador
-
 Egypt
Egypt
-
 El Salvador
-
 Estonia
-
 Eswatini
-
 Ethiopia
-
 Finland
-
 France
-
 Georgia
-
 Germany
-
 Ghana
Ghana
-
 Greece
-
 Haiti
Haiti
-
 Hong Kong
-
 Hungary
-
 India
India
-
 Indonesia
-
 Iran, Islamic republic
-
 Iraq
Iraq
-
 Ireland
-
 Israel
-
 Italy
Italy
-
 Jamaica
-
 Japan
Japan
-
 Jordan
-
 Kazakhstan
-
 Kenya
Kenya
-
 Korea
Korea
-
 Kuwait
-
 Kyrgyzstan
-
 Laos
Laos
-
 Latvia
-
 Lebanon
-
 Lesotho
-
 Libya
Libya
-
 Lithuania
-
 Luxembourg
-
 Madagascar
-
 Malaysia
-
 Malta
Malta
-
 Mauritius
-
 Mexico
-
 Moldova
-
 Mongolia
-
 Montenegro
-
 Morocco
-
 Mozambique
-
 Myanmar
-
 Namibia
-
 Nepal
Nepal
-
 Netherlands
-
 New Zealand
-
 Nigeria
-
 North Macedonia
-
 Norway
-
 Oman
Oman
-
 Pakistan
-
 Palestine
-
 Panama
-
 Papua New Guinea
-
 Paraguay
-
 Peru
Peru
-
 Philippines
-
 Poland
-
 Portugal
-
 Puerto Rico
-
 Qatar
Qatar
-
 Reunion
-
 Romania
-
 Rwanda
-
 Saudi Arabia
-
 Serbia
-
 Singapore
-
 Slovakia
-
 Slovenia
-
 Somalia
-
 South Africa
-
 Spain
Spain
-
 Sri Lanka
-
 Sweden
-
 Switzerland
-
 Syria
Syria
-
 Taiwan
-
 Tajikistan
-
 Tanzania
-
 Thailand
-
 Trinidad and Tobago
-
 Tunisia
-
 Turkey
-
 UAE
UAE
-
 Uganda
-
 Ukraine
-
 United Kingdom
-
United States
-
 Uruguay
-
 Uzbekistan
-
 Venezuela
-
 Vietnam
-
 Yemen
Yemen
-
 Zambia
-
 Zimbabwe
- Forex
- Crypto
