
Quantum Computing stock gains 6.27% as price rebounds from volatile session lows

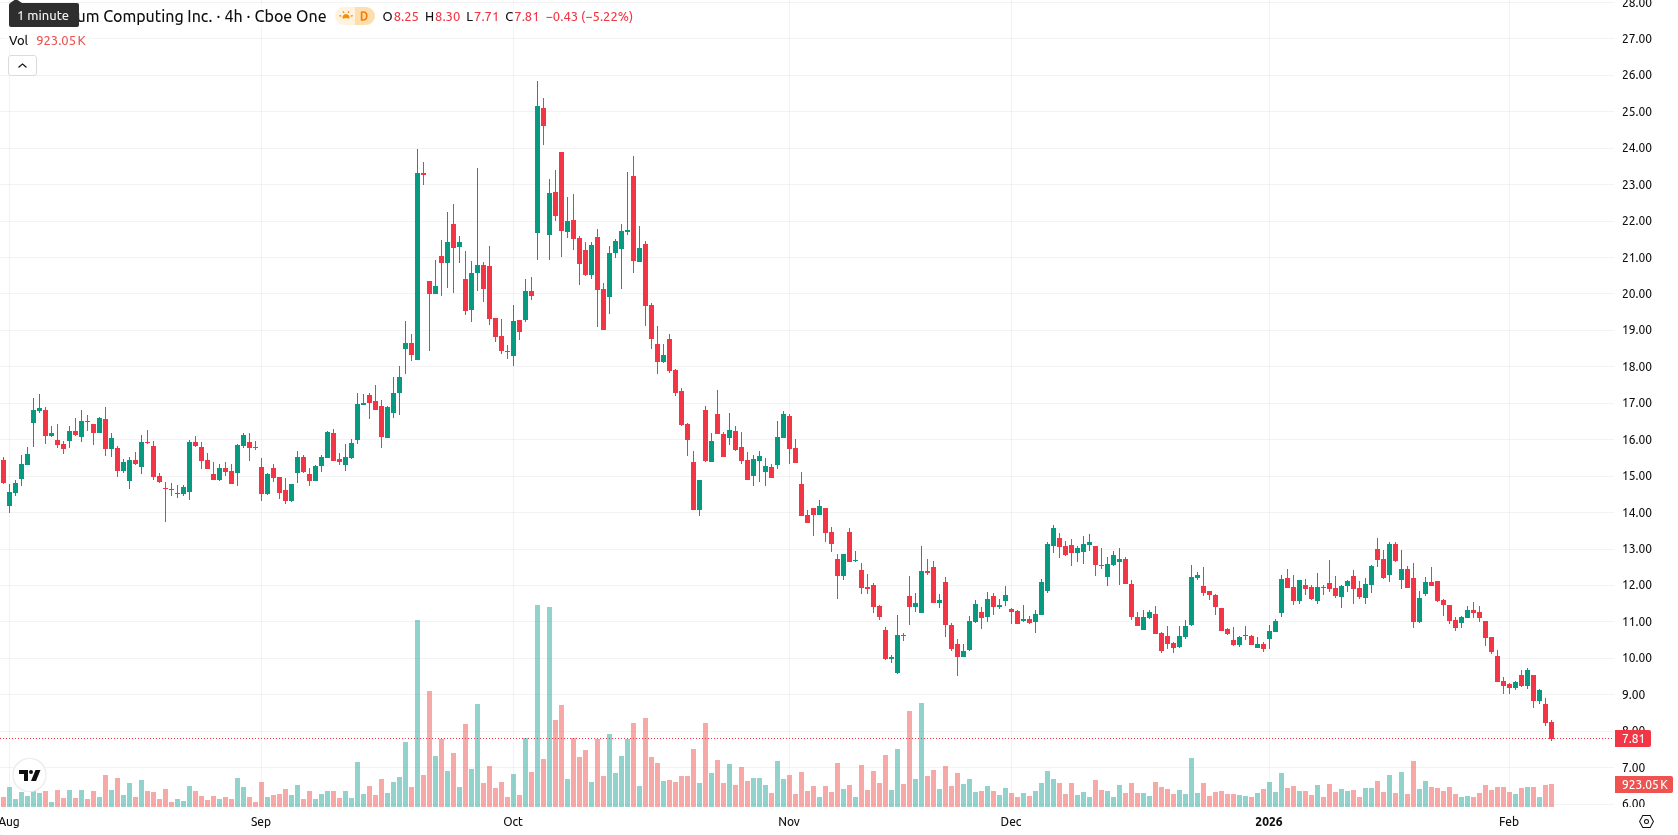
Quantum Computing Inc. (QUBT) is trading at $8.30, which is well below the Moving Average-20 ($11.03), MA-50 ($11.37), and MA-200 ($14.32), confirming persistent downward pressure across short-, medium-, and long-term trends. The nearest dynamic resistance from Ichimoku Kijun is at $10.52, while no strong dynamic supports appear in the range.
Highlights
- QUBT is trading at $8.30, significantly below the MA-20 ($11.03), MA-50 ($11.37), and MA-200 ($14.32), reinforcing bearish trends across all timeframes.
- Momentum indicators such as MACD, RSI (29.65), CCI (–183.48), and Stochastic RSI (0.00) signal oversold conditions but persistent selling pressure.
- Expected price action for the coming week is largely sideways between $7.70 and $9.20, with strong resistance at $10.52 and higher probability of further downside below $7.70.
Bearish momentum deepens as oversold signals and high volatility emerge
Momentum signals are weak, with MACD on daily and weekly settings both in negative territory and confirming a prevailing bearish trend. Oversold conditions are seen in the Relative Strength Index (29.65), Commodity Channel Index (–183.48), and Stochastic RSI (0.00), indicating selling has likely been overextended in the short term. Bull/Bear Power also points to seller dominance intraday. The Awesome Oscillator reading supports further downward momentum. Today's session opened at $8.77 (gap up from previous close at $7.81) before pulling back to $8.30, with price now sitting closer to the bottom of today’s range ($7.72 — $8.88), reflecting high intraday volatility. The overall tone shows initial strength after the open but renewed pressure from sellers toward session lows.
Sideways bias prevails as sustained upside faces low probability
For the coming week, the expected price range is defined by a typical volatility band between $7.70 and $9.20, with the current price near the middle of this range. There is a very low probability (less than 20%) of a sustained price increase, as the uniform 'sell' signals from major weekly indicators suggest renewed downside risk. The baseline scenario calls for sideways trading between $7.70 and $9.20. A bullish move would require a breakout above $9.20, targeting resistance near $10.50, while a decline below $7.70 could expose QUBT to further downside and possible retests of recent lows.
Last time, analysts noted that Quantum Computing Inc. remains under strong bearish pressure, with the price trading well below all major moving averages and momentum indicators such as MACD, ADX, and RSI confirming persistent negative sentiment and oversold conditions. Key resistance lies at the Ichimoku Kijun near $10.97 with no immediate dynamic support, and no bullish reversal signals have emerged, suggesting the downside risk continues to prevail.


Latest Quantum Computing News


-
 Afghanistan
-
 Albania
-
 Algeria
-
 Angola
-
 Argentina
-
 Armenia
-
 Australia
-
 Austria
-
 Azerbaijan
-
 Bahamas
-
 Bahrain
-
 Bangladesh
-
 Belarus
-
 Belgium
-
 Bolivia
-
 Botswana
-
 Brazil
-
 Brunei
-
 Bulgaria
-
 Cambodia
-
 Cameroon
-
 Canada
-
 Chile
Chile
-
 China
China
-
 Colombia
-
 Congo
Congo
-
 Costa Rica
-
 Cote d'Ivoire
-
 Croatia
-
 Cuba
Cuba
-
 Cyprus
-
 Czechia
-
 DR Congo
-
 Denmark
-
 Dominican Republic
-
 Ecuador
-
 Egypt
Egypt
-
 El Salvador
-
 Estonia
-
 Eswatini
-
 Ethiopia
-
 Finland
-
 France
-
 Georgia
-
 Germany
-
 Ghana
Ghana
-
 Greece
-
 Haiti
Haiti
-
 Hong Kong
-
 Hungary
-
 India
India
-
 Indonesia
-
 Iran, Islamic republic
-
 Iraq
Iraq
-
 Ireland
-
 Israel
-
 Italy
Italy
-
 Jamaica
-
 Japan
Japan
-
 Jordan
-
 Kazakhstan
-
 Kenya
Kenya
-
 Korea
Korea
-
 Kuwait
-
 Kyrgyzstan
-
 Laos
Laos
-
 Latvia
-
 Lebanon
-
 Lesotho
-
 Libya
Libya
-
 Lithuania
-
 Luxembourg
-
 Madagascar
-
 Malaysia
-
 Malta
Malta
-
 Mauritius
-
 Mexico
-
 Moldova
-
 Mongolia
-
 Montenegro
-
 Morocco
-
 Mozambique
-
 Myanmar
-
 Namibia
-
 Nepal
Nepal
-
 Netherlands
-
 New Zealand
-
 Nigeria
-
 North Macedonia
-
 Norway
-
 Oman
Oman
-
 Pakistan
-
 Palestine
-
 Panama
-
 Papua New Guinea
-
 Paraguay
-
 Peru
Peru
-
 Philippines
-
 Poland
-
 Portugal
-
 Puerto Rico
-
 Qatar
Qatar
-
 Reunion
-
 Romania
-
 Rwanda
-
 Saudi Arabia
-
 Serbia
-
 Singapore
-
 Slovakia
-
 Slovenia
-
 Somalia
-
 South Africa
-
 Spain
Spain
-
 Sri Lanka
-
 Sweden
-
 Switzerland
-
 Syria
Syria
-
 Taiwan
-
 Tajikistan
-
 Tanzania
-
 Thailand
-
 Trinidad and Tobago
-
 Tunisia
-
 Turkey
-
 UAE
UAE
-
 Uganda
-
 Ukraine
-
 United Kingdom
-
United States
-
 Uruguay
-
 Uzbekistan
-
 Venezuela
-
 Vietnam
-
 Yemen
Yemen
-
 Zambia
-
 Zimbabwe
- Forex
- Crypto
