
Sundial Growers stock: Subdued momentum signals support a 3.08% daily gain

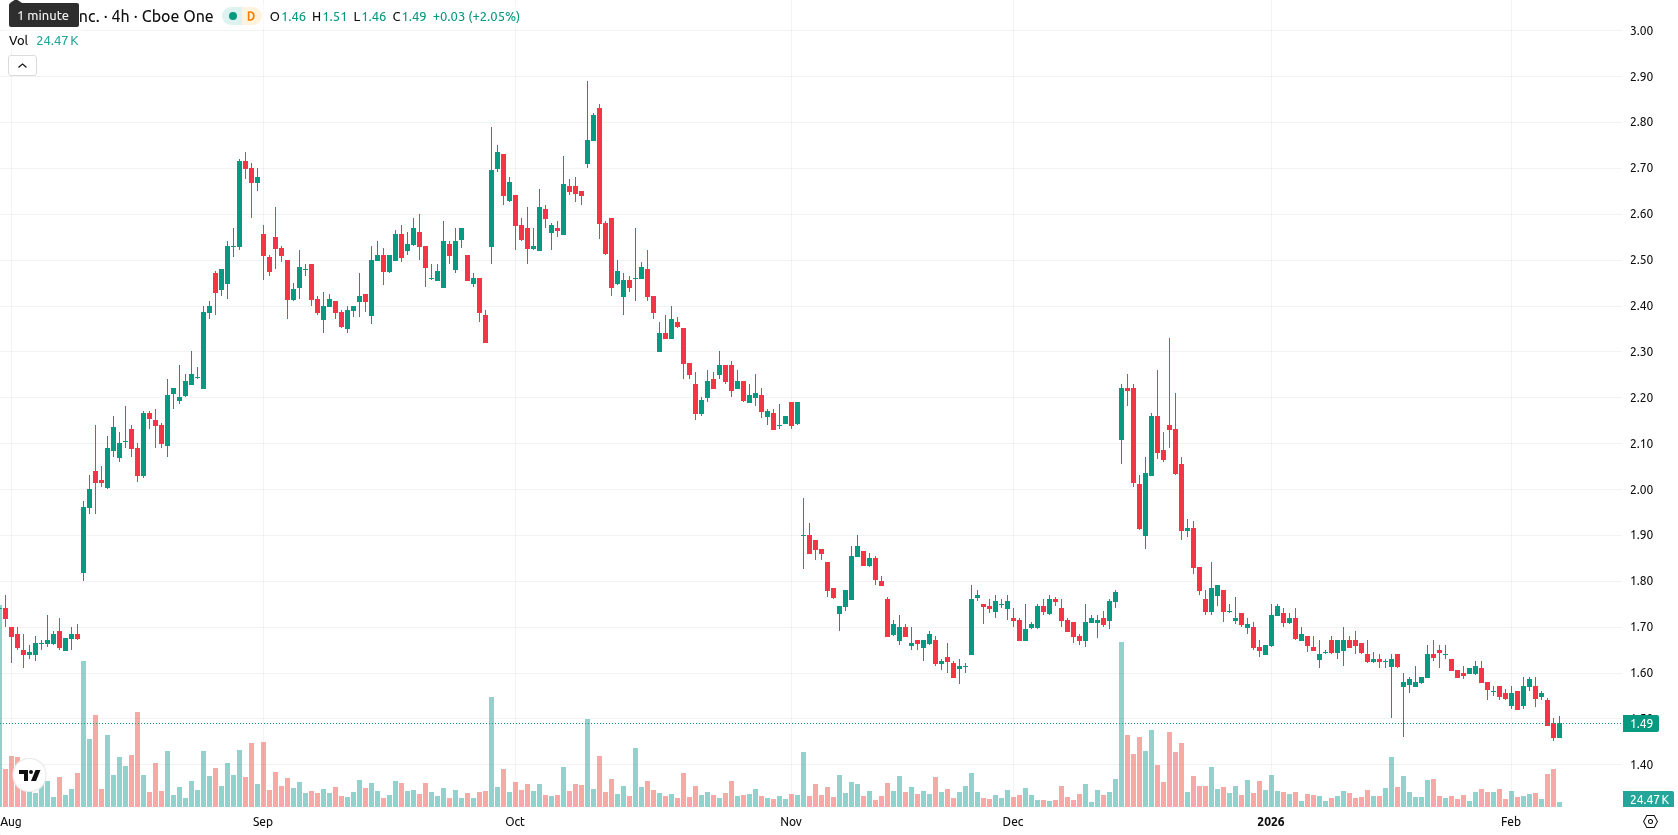
Sundial Growers Inc. (SNDL) is trading below its key moving averages, with the current price of $1.51 showing a daily gain of 3.08%. The asset remains under pressure, staying beneath the MA-20, MA-50, and MA-200, and is consolidating just below its nearest resistance levels.
Highlights
- SNDL trades at $1.51, below the MA-20 ($1.60), MA-50 ($1.71), and MA-200 ($1.79), signaling enduring downside pressure across all timeframes.
- Oscillators including MACD, RSI, and Stochastic RSI show persistent oversold conditions with weak trend strength, confirming seller dominance amid moderate intraday volatility.
- SNDL's technical range over the next five sessions is expected between $1.46 support and $1.65 resistance, with less than 20% probability of sustained upside.
Oversold momentum and seller dominance amid persistent technical weakness
The current price of SNDL ($1.51) remains below the MA-20 ($1.60), MA-50 ($1.71), and MA-200 ($1.79) levels, indicating persistent downward pressure across short-, medium-, and long-term trends. The nearest dynamic resistance is the Ichimoku Kijun at $1.60, while immediate support is likely found near the session low of $1.46. Momentum signals remain subdued, with the MACD confirming a selling bias and the ADX pointing to weak trend strength. Both the RSI and Commodity Channel Index indicate persistent oversold conditions, while the Stochastic RSI also flags an oversold environment on the daily timeframe. Bull/Bear Power is negative, further confirming seller dominance intraday.
Further downside likely as volatility bands cap short-term upside
The expected price range for SNDL over the next five trading days is $1.46 to $1.65, representing a typical volatility band relative to current levels. There is a very low probability (less than 20%) of a sustained price increase, making additional downside more likely under current technical conditions. In the baseline scenario, SNDL is likely to fluctuate between $1.46 and $1.65, indicating sideways consolidation. Upside requires a decisive move above $1.60 toward $1.65, while a breakdown below $1.46 could expose the stock to further pressure and fresh lows.
Previously it was reported that SNDL is trading below its short-, medium-, and long-term moving averages, with weak momentum indicated by a negative MACD, low ADX, and multiple oversold signals including RSI and Stoch RSI. While intraday price action shows a modest recovery and low volatility, sellers remain in control and the likelihood of a sustained rebound appears limited unless the price can surpass nearby resistance levels.


-
 Afghanistan
-
 Albania
-
 Algeria
-
 Angola
-
 Argentina
-
 Armenia
-
 Australia
-
 Austria
-
 Azerbaijan
-
 Bahamas
-
 Bahrain
-
 Bangladesh
-
 Belarus
-
 Belgium
-
 Bolivia
-
 Botswana
-
 Brazil
-
 Brunei
-
 Bulgaria
-
 Cambodia
-
 Cameroon
-
 Canada
-
 Chile
Chile
-
 China
China
-
 Colombia
-
 Congo
Congo
-
 Costa Rica
-
 Cote d'Ivoire
-
 Croatia
-
 Cuba
Cuba
-
 Cyprus
-
 Czechia
-
 DR Congo
-
 Denmark
-
 Dominican Republic
-
 Ecuador
-
 Egypt
Egypt
-
 El Salvador
-
 Estonia
-
 Eswatini
-
 Ethiopia
-
 Finland
-
 France
-
 Georgia
-
 Germany
-
 Ghana
Ghana
-
 Greece
-
 Haiti
Haiti
-
 Hong Kong
-
 Hungary
-
 India
India
-
 Indonesia
-
 Iran, Islamic republic
-
 Iraq
Iraq
-
 Ireland
-
 Israel
-
 Italy
Italy
-
 Jamaica
-
 Japan
Japan
-
 Jordan
-
 Kazakhstan
-
 Kenya
Kenya
-
 Korea
Korea
-
 Kuwait
-
 Kyrgyzstan
-
 Laos
Laos
-
 Latvia
-
 Lebanon
-
 Lesotho
-
 Libya
Libya
-
 Lithuania
-
 Luxembourg
-
 Madagascar
-
 Malaysia
-
 Malta
Malta
-
 Mauritius
-
 Mexico
-
 Moldova
-
 Mongolia
-
 Montenegro
-
 Morocco
-
 Mozambique
-
 Myanmar
-
 Namibia
-
 Nepal
Nepal
-
 Netherlands
-
 New Zealand
-
 Nigeria
-
 North Macedonia
-
 Norway
-
 Oman
Oman
-
 Pakistan
-
 Palestine
-
 Panama
-
 Papua New Guinea
-
 Paraguay
-
 Peru
Peru
-
 Philippines
-
 Poland
-
 Portugal
-
 Puerto Rico
-
 Qatar
Qatar
-
 Reunion
-
 Romania
-
 Rwanda
-
 Saudi Arabia
-
 Serbia
-
 Singapore
-
 Slovakia
-
 Slovenia
-
 Somalia
-
 South Africa
-
 Spain
Spain
-
 Sri Lanka
-
 Sweden
-
 Switzerland
-
 Syria
Syria
-
 Taiwan
-
 Tajikistan
-
 Tanzania
-
 Thailand
-
 Trinidad and Tobago
-
 Tunisia
-
 Turkey
-
 UAE
UAE
-
 Uganda
-
 Ukraine
-
 United Kingdom
-
United States
-
 Uruguay
-
 Uzbekistan
-
 Venezuela
-
 Vietnam
-
 Yemen
Yemen
-
 Zambia
-
 Zimbabwe
- Forex
- Crypto
