
JetBlue Airways stock rises 5.03% as buyers dominate and price tests session highs

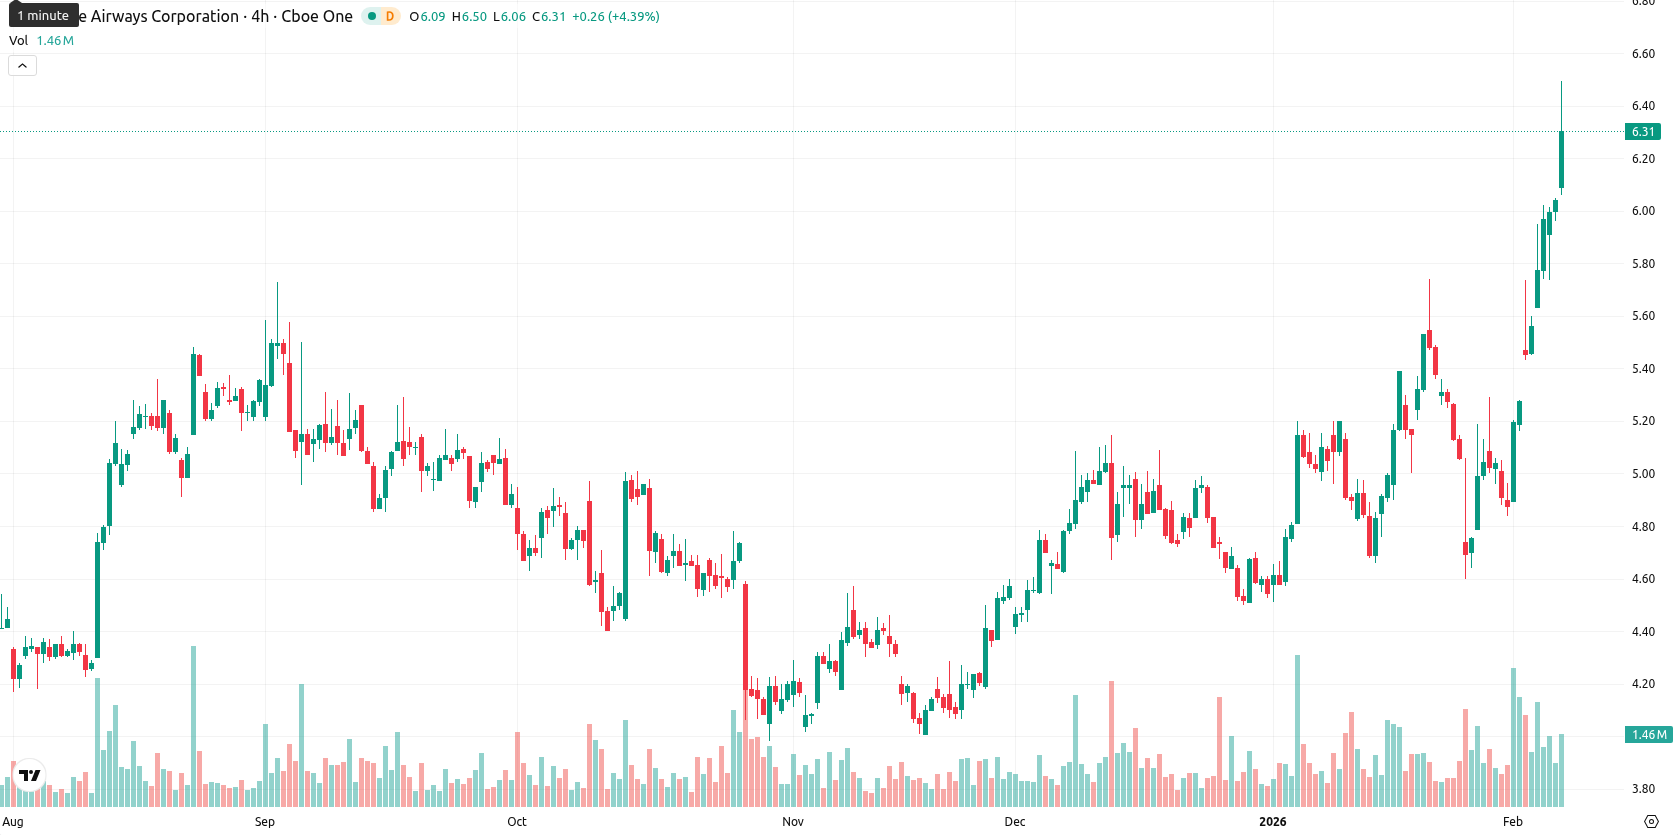
JetBlue Airways Corp (JBLU) is trading at $6.34, marking a daily advance of 5.03%. The price sits firmly above its 20-day ($5.21), 50-day ($4.92), and 200-day ($4.73) Simple Moving Averages, underscoring consistent bullish momentum across short-, medium-, and long-term trends.
Highlights
- JetBlue Airways closed at $6.34, decisively above its 20-day ($5.21), 50-day ($4.92), and 200-day ($4.73) SMAs, reinforcing multi-timeframe bullish momentum.
- Daily and weekly MACD and RSI remain in 'Buy' territory, with the Awesome Oscillator positive, while Stochastic RSI and CCI indicate overbought conditions.
- Dynamic support lies at the Ichimoku Kijun ($5.28) and near $6.10, resistance sits near $6.50–$6.90, with an 80%+ probability of further upside.
Resistance tests emerge as buyers sustain momentum
Technical analysis shows the Ichimoku Kijun at $5.28 serves as the nearest dynamic support, while resistance is expected near the recent session high and round levels above $6.50. Momentum remains strong, with daily and weekly MACD and RSI all pointing to a buy signal, and the Awesome Oscillator supporting the ongoing trend. However, Stochastic RSI and Commodity Channel Index highlight overbought conditions, and Bull/Bear Power readings indicate a dominance of buyers in intraday trading. The current price is trading close to the day's high ($6.49), reflecting elevated volatility and persistent strength toward session highs.
Bullish advance likely as volatility sets near-term range
In the near term, JetBlue Airways is likely to see a price band between $6.10 and $6.90 based on typical volatility relative to current levels. Bullish momentum is expected to dominate, and an upward move to test $6.90 or higher may occur if strengths persist. A retracement below $6.10 would indicate a potential pullback, but this scenario is less likely given the current technical setup. Sideways consolidation within this volatility band remains the base case for the next five trading days.
Last time, analysts noted that JetBlue Airways remains in a bullish trend, trading well above key moving averages, with current momentum indicators such as MACD and RSI confirming a strong buy signal despite moderate trend strength. Support is established near $5.13, while resistance is expected near $6.00, and overbought signals suggest the potential for short-term consolidation within a defined trading range.


Latest JetBlue News


-
 Afghanistan
-
 Albania
-
 Algeria
-
 Angola
-
 Argentina
-
 Armenia
-
 Australia
-
 Austria
-
 Azerbaijan
-
 Bahamas
-
 Bahrain
-
 Bangladesh
-
 Belarus
-
 Belgium
-
 Bolivia
-
 Botswana
-
 Brazil
-
 Brunei
-
 Bulgaria
-
 Cambodia
-
 Cameroon
-
 Canada
-
 Chile
Chile
-
 China
China
-
 Colombia
-
 Congo
Congo
-
 Costa Rica
-
 Cote d'Ivoire
-
 Croatia
-
 Cuba
Cuba
-
 Cyprus
-
 Czechia
-
 DR Congo
-
 Denmark
-
 Dominican Republic
-
 Ecuador
-
 Egypt
Egypt
-
 El Salvador
-
 Estonia
-
 Eswatini
-
 Ethiopia
-
 Finland
-
 France
-
 Georgia
-
 Germany
-
 Ghana
Ghana
-
 Greece
-
 Haiti
Haiti
-
 Hong Kong
-
 Hungary
-
 India
India
-
 Indonesia
-
 Iran, Islamic republic
-
 Iraq
Iraq
-
 Ireland
-
 Israel
-
 Italy
Italy
-
 Jamaica
-
 Japan
Japan
-
 Jordan
-
 Kazakhstan
-
 Kenya
Kenya
-
 Korea
Korea
-
 Kuwait
-
 Kyrgyzstan
-
 Laos
Laos
-
 Latvia
-
 Lebanon
-
 Lesotho
-
 Libya
Libya
-
 Lithuania
-
 Luxembourg
-
 Madagascar
-
 Malaysia
-
 Malta
Malta
-
 Mauritius
-
 Mexico
-
 Moldova
-
 Mongolia
-
 Montenegro
-
 Morocco
-
 Mozambique
-
 Myanmar
-
 Namibia
-
 Nepal
Nepal
-
 Netherlands
-
 New Zealand
-
 Nigeria
-
 North Macedonia
-
 Norway
-
 Oman
Oman
-
 Pakistan
-
 Palestine
-
 Panama
-
 Papua New Guinea
-
 Paraguay
-
 Peru
Peru
-
 Philippines
-
 Poland
-
 Portugal
-
 Puerto Rico
-
 Qatar
Qatar
-
 Reunion
-
 Romania
-
 Rwanda
-
 Saudi Arabia
-
 Serbia
-
 Singapore
-
 Slovakia
-
 Slovenia
-
 Somalia
-
 South Africa
-
 Spain
Spain
-
 Sri Lanka
-
 Sweden
-
 Switzerland
-
 Syria
Syria
-
 Taiwan
-
 Tajikistan
-
 Tanzania
-
 Thailand
-
 Trinidad and Tobago
-
 Tunisia
-
 Turkey
-
 UAE
UAE
-
 Uganda
-
 Ukraine
-
 United Kingdom
-
United States
-
 Uruguay
-
 Uzbekistan
-
 Venezuela
-
 Vietnam
-
 Yemen
Yemen
-
 Zambia
-
 Zimbabwe
- Forex
- Crypto
