
Microsoft stock: Strong revenue and EPS lift price despite downside risks

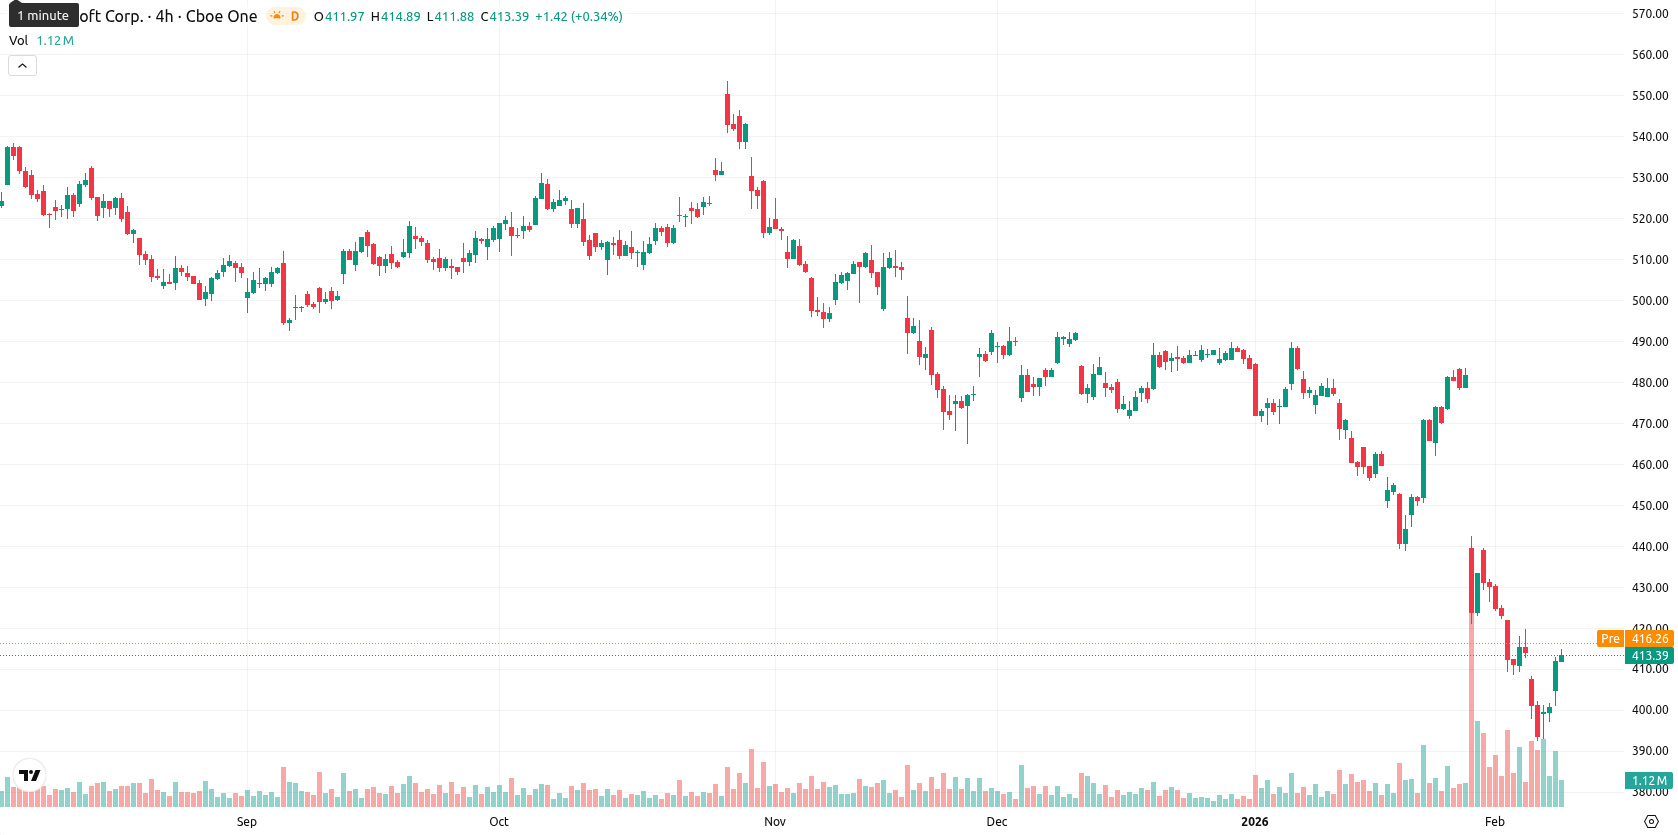
Microsoft Corporation (MSFT) shares are trading at $414.01, below the MA-20 ($444.70), MA-50 ($467.62), and MA-200 ($487.09), indicating persistent seller pressure in the short, medium, and long term. The closest dynamic resistance is the Ichimoku Kijun at $441.01, while immediate short-term support could be found near the Hull Moving Average at $394.74.
Highlights
- Microsoft posted Q2 FY2026 revenue of $81.3 billion (up 17% YoY) and adjusted EPS of $4.14, both surpassing consensus forecasts.
- Despite strong results and $625 billion in commercial remaining performance obligations, investors questioned Azure cloud growth and sustainability of high AI-related capital expenditures.
- Shares trade at $414.01, below key moving averages (MA-20: $444.70), with $400.00 as near-term support and $441.00 as resistance amid elevated short-term downside risk.
Azure concerns temper upbeat earnings amid robust AI momentum
Microsoft reported its Q2 fiscal year 2026 earnings on January 28, posting total revenue of $81.3 billion, a 17% year-over-year increase, and adjusted earnings per share of $4.14, both exceeding expectations. Despite strong top-line results, investors expressed concern about slower Azure cloud growth and questions on the sustainability of high capital expenditures related to artificial intelligence. The company continues to expand its AI and cloud businesses, highlighted by $625 billion in commercial remaining performance obligations and significant enterprise adoption of its Copilot product.
Weak momentum signals diverge from price gains as sellers dominate
Momentum signals on the daily chart are mixed: the MACD and ADX both indicate a bearish bias, while the RSI (36.27) and CCI (-98.88) confirm underlying weakness, but the Stochastic RSI is neutral and Bull/Bear Power is classified as oversold, suggesting sellers still dominate. The Awesome Oscillator also points down, reinforcing the overall negative trend. Today, the stock opened flat versus the previous close with no gap and has climbed 3.07%, now trading near the daily high of its range. Intraday volatility is moderate, and the tone reflects strength toward the highs, though underlying momentum signals do not uniformly confirm this upward move, creating a divergence between price action and momentum.
Downside risk prevails as probability of rebound remains low
For the next five trading days, the expected price corridor for Microsoft is between $400.00 and $425.00. The probability of a price increase is very low (less than 20%), making a decline much more likely. In the baseline scenario, the shares are likely to consolidate sideways within this volatility band. A bullish scenario would require a decisive breakout above the $441.00 resistance, while a bearish scenario could be seen if the stock falls below the $400.00 support region. Both daily and weekly trend indicators suggest that downward risk remains elevated in the short term.
Last time, analysts noted that Microsoft Corporation was trading well below its major moving averages, with persistent downward momentum as indicated by both MACD and ADX in sell mode, while oscillators such as RSI and Stoch RSI signaled oversold conditions. The stock faces resistance near the Ichimoku Kijun at $441, with no clear technical support, implying any oversold rebounds may be limited as the primary trend remains under pressure.


Latest Microsoft News


-
 Afghanistan
-
 Albania
-
 Algeria
-
 Angola
-
 Argentina
-
 Armenia
-
 Australia
-
 Austria
-
 Azerbaijan
-
 Bahamas
-
 Bahrain
-
 Bangladesh
-
 Belarus
-
 Belgium
-
 Bolivia
-
 Botswana
-
 Brazil
-
 Brunei
-
 Bulgaria
-
 Cambodia
-
 Cameroon
-
 Canada
-
 Chile
Chile
-
 China
China
-
 Colombia
-
 Congo
Congo
-
 Costa Rica
-
 Cote d'Ivoire
-
 Croatia
-
 Cuba
Cuba
-
 Cyprus
-
 Czechia
-
 DR Congo
-
 Denmark
-
 Dominican Republic
-
 Ecuador
-
 Egypt
Egypt
-
 El Salvador
-
 Estonia
-
 Eswatini
-
 Ethiopia
-
 Finland
-
 France
-
 Georgia
-
 Germany
-
 Ghana
Ghana
-
 Greece
-
 Haiti
Haiti
-
 Hong Kong
-
 Hungary
-
 India
India
-
 Indonesia
-
 Iran, Islamic republic
-
 Iraq
Iraq
-
 Ireland
-
 Israel
-
 Italy
Italy
-
 Jamaica
-
 Japan
Japan
-
 Jordan
-
 Kazakhstan
-
 Kenya
Kenya
-
 Korea
Korea
-
 Kuwait
-
 Kyrgyzstan
-
 Laos
Laos
-
 Latvia
-
 Lebanon
-
 Lesotho
-
 Libya
Libya
-
 Lithuania
-
 Luxembourg
-
 Madagascar
-
 Malaysia
-
 Malta
Malta
-
 Mauritius
-
 Mexico
-
 Moldova
-
 Mongolia
-
 Montenegro
-
 Morocco
-
 Mozambique
-
 Myanmar
-
 Namibia
-
 Nepal
Nepal
-
 Netherlands
-
 New Zealand
-
 Nigeria
-
 North Macedonia
-
 Norway
-
 Oman
Oman
-
 Pakistan
-
 Palestine
-
 Panama
-
 Papua New Guinea
-
 Paraguay
-
 Peru
Peru
-
 Philippines
-
 Poland
-
 Portugal
-
 Puerto Rico
-
 Qatar
Qatar
-
 Reunion
-
 Romania
-
 Rwanda
-
 Saudi Arabia
-
 Serbia
-
 Singapore
-
 Slovakia
-
 Slovenia
-
 Somalia
-
 South Africa
-
 Spain
Spain
-
 Sri Lanka
-
 Sweden
-
 Switzerland
-
 Syria
Syria
-
 Taiwan
-
 Tajikistan
-
 Tanzania
-
 Thailand
-
 Trinidad and Tobago
-
 Tunisia
-
 Turkey
-
 UAE
UAE
-
 Uganda
-
 Ukraine
-
 United Kingdom
-
United States
-
 Uruguay
-
 Uzbekistan
-
 Venezuela
-
 Vietnam
-
 Yemen
Yemen
-
 Zambia
-
 Zimbabwe
- Forex
- Crypto
