
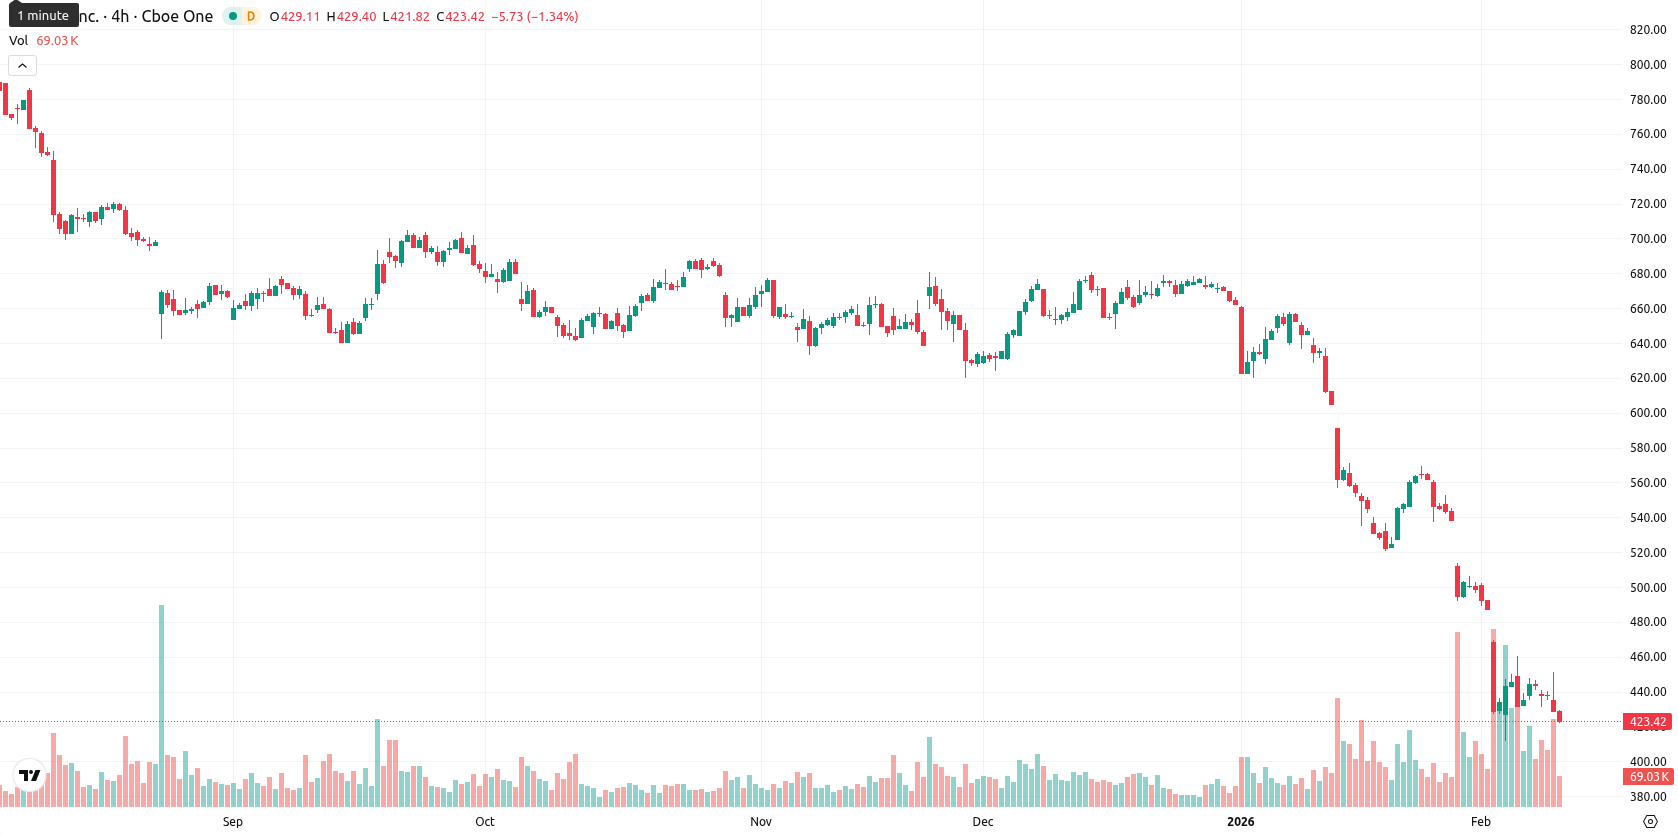
Intuit stock falls 3.18% as price sinks below all key moving averages

Intuit Inc. (INTU) is trading at $423.60 after dropping $13.90 or 3.18% on the day, moving well below its MA-20 ($520.15), MA-50 ($602.65), and MA-200 ($676.41). This places INTU under sustained downward pressure across short, medium, and long-term periods with the price now hovering near session lows, significantly beneath all key moving averages.
Highlights
- Intuit expanded its physical presence by opening a flagship TurboTax store in SoHo, New York City, and launching nearly 600 Expert Office locations nationwide to enhance hybrid tax-filing services.
- The company introduced new Mailchimp product enhancements focused on marketing automation and data integration to support international ecommerce clients, underscoring ongoing product innovation.
- INTU shares closed at $423.60, showing strong bearish momentum with an RSI of 23.19 and potential further downside risk if support at $421 is breached.
Expansion of retail and digital reach drives strategic repositioning
Intuit has recently expanded its physical footprint by opening a flagship TurboTax store in New York City's SoHo area and launching nearly 600 Expert Office locations across the country to enhance its blend of digital and in-person tax filing services. The company also introduced new product enhancements for Mailchimp, aimed at improving marketing automation and data integration for ecommerce clients internationally. These strategic moves reflect ongoing efforts to strengthen core product offerings and adapt to evolving customer needs.
Bearish momentum prevails as key supports and oscillators weaken
From a technical perspective, INTU is encountering strong downward momentum as its price remains significantly below the MA-20, MA-50, and MA-200 levels, currently well below the Ichimoku Kijun resistance at $535.97. Support is being tested near the present lows and there is no golden or death cross between the MA-50 and MA-200. Momentum oscillators signal a robust bearish bias with a negative MACD, high ADX reading, and extremely oversold readings in the RSI (23.19), negative Bull/Bear Power, and oversold Commodity Channel Index. Seller dominance is further confirmed by a negative Awesome Oscillator and a sharp intraday decline accompanied by elevated volatility.
Downside risk intensifies amid volatility and limited rebound odds
Looking towards the next five sessions, INTU is likely to remain within a volatility band between $410 and $440. The probability of a further decline exceeds 80%, as technical pressures and oversold conditions dominate, while the chance of a rebound is minimal. Consolidation within this range is the baseline scenario until oversold signals start to reverse. A sustained move above $535.97 would be needed to spark a potential bullish shift, but the setup instead points to continued downside risk if support at $421 is breached.
Previously it was reported that Intuit Inc. remained under sustained selling pressure, with its price well below key short-, medium-, and long-term moving averages and showing persistent negative momentum according to daily MACD and ADX indicators. However, a cluster of oversold readings from oscillators including RSI and CCI, combined with a strong intraday rebound, suggests risk of short-term bounce attempts even as the broader downtrend remains intact, with major resistance near the Ichimoku Kijun level.


-
 Afghanistan
-
 Albania
-
 Algeria
-
 Angola
-
 Argentina
-
 Armenia
-
 Australia
-
 Austria
-
 Azerbaijan
-
 Bahamas
-
 Bahrain
-
 Bangladesh
-
 Belarus
-
 Belgium
-
 Bolivia
-
 Botswana
-
 Brazil
-
 Brunei
-
 Bulgaria
-
 Cambodia
-
 Cameroon
-
 Canada
-
 Chile
Chile
-
 China
China
-
 Colombia
-
 Congo
Congo
-
 Costa Rica
-
 Cote d'Ivoire
-
 Croatia
-
 Cuba
Cuba
-
 Cyprus
-
 Czechia
-
 DR Congo
-
 Denmark
-
 Dominican Republic
-
 Ecuador
-
 Egypt
Egypt
-
 El Salvador
-
 Estonia
-
 Eswatini
-
 Ethiopia
-
 Finland
-
 France
-
 Georgia
-
 Germany
-
 Ghana
Ghana
-
 Greece
-
 Haiti
Haiti
-
 Hong Kong
-
 Hungary
-
 India
India
-
 Indonesia
-
 Iran, Islamic republic
-
 Iraq
Iraq
-
 Ireland
-
 Israel
-
 Italy
Italy
-
 Jamaica
-
 Japan
Japan
-
 Jordan
-
 Kazakhstan
-
 Kenya
Kenya
-
 Korea
Korea
-
 Kuwait
-
 Kyrgyzstan
-
 Laos
Laos
-
 Latvia
-
 Lebanon
-
 Lesotho
-
 Libya
Libya
-
 Lithuania
-
 Luxembourg
-
 Madagascar
-
 Malaysia
-
 Malta
Malta
-
 Mauritius
-
 Mexico
-
 Moldova
-
 Mongolia
-
 Montenegro
-
 Morocco
-
 Mozambique
-
 Myanmar
-
 Namibia
-
 Nepal
Nepal
-
 Netherlands
-
 New Zealand
-
 Nigeria
-
 North Macedonia
-
 Norway
-
 Oman
Oman
-
 Pakistan
-
 Palestine
-
 Panama
-
 Papua New Guinea
-
 Paraguay
-
 Peru
Peru
-
 Philippines
-
 Poland
-
 Portugal
-
 Puerto Rico
-
 Qatar
Qatar
-
 Reunion
-
 Romania
-
 Rwanda
-
 Saudi Arabia
-
 Serbia
-
 Singapore
-
 Slovakia
-
 Slovenia
-
 Somalia
-
 South Africa
-
 Spain
Spain
-
 Sri Lanka
-
 Sweden
-
 Switzerland
-
 Syria
Syria
-
 Taiwan
-
 Tajikistan
-
 Tanzania
-
 Thailand
-
 Trinidad and Tobago
-
 Tunisia
-
 Turkey
-
 UAE
UAE
-
 Uganda
-
 Ukraine
-
 United Kingdom
-
United States
-
 Uruguay
-
 Uzbekistan
-
 Venezuela
-
 Vietnam
-
 Yemen
Yemen
-
 Zambia
-
 Zimbabwe
- Forex
- Crypto
