
Bearish technical setup and weak momentum — SoFi stock drops 3.45%

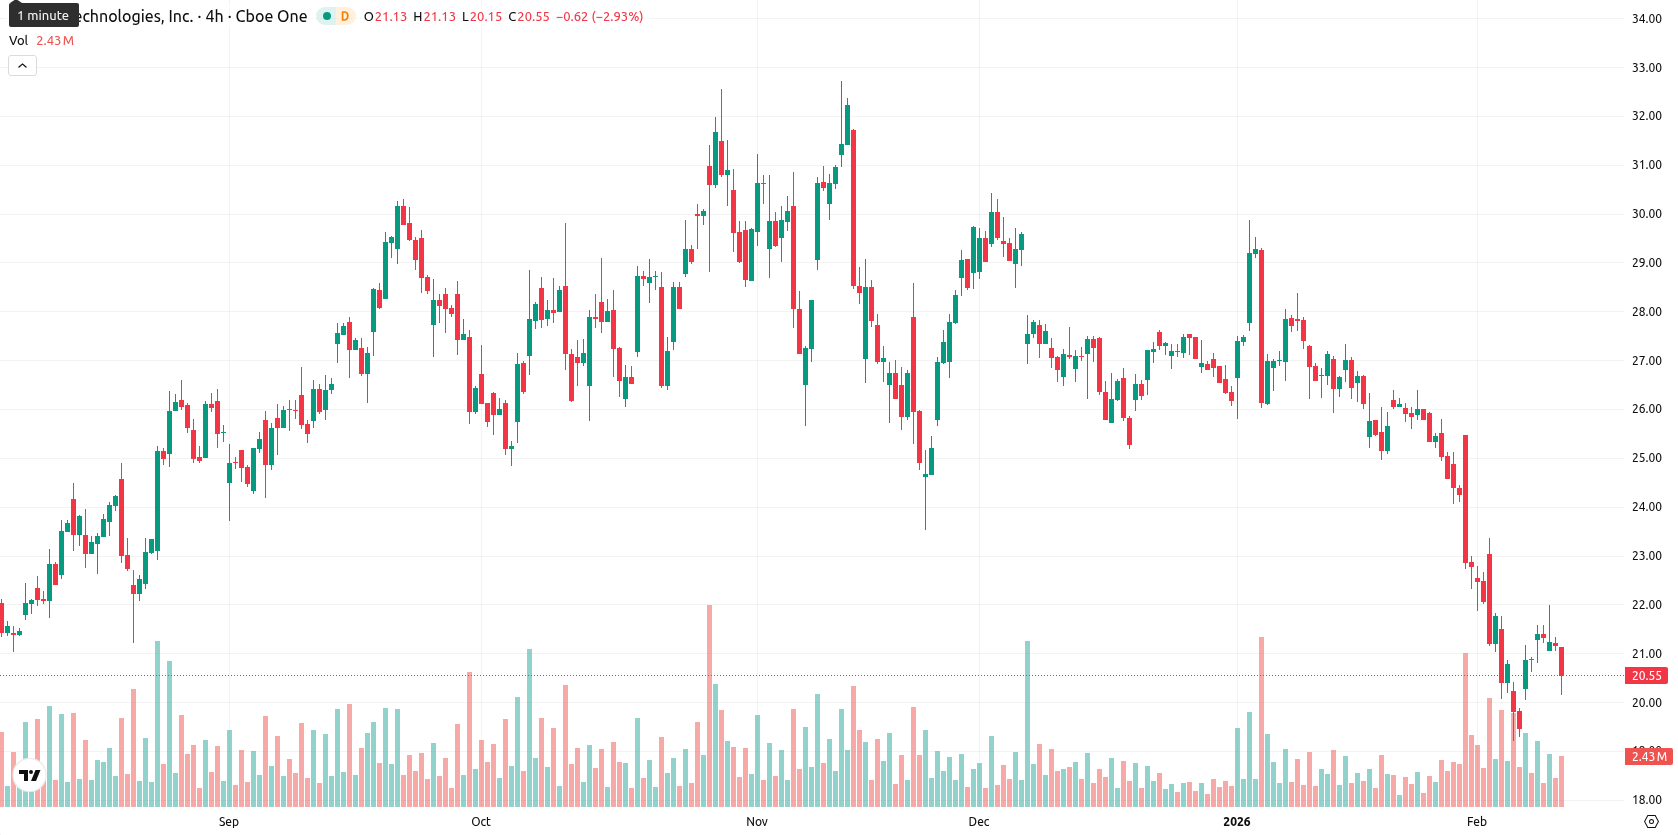
SoFi Technologies, Inc. (SOFI) is trading at $20.43, below the MA-20 ($23.99), MA-50 ($26.05), and MA-200 ($23.03), indicating prevailing downward pressure across all key moving averages and confirming a bearish trend in the short, medium, and long term.
Highlights
- SoFi reported strong Q4 2025 results with adjusted net revenue of $1.013 billion, up 37% year-over-year, and GAAP EPS of $0.13, marking its ninth straight quarter of profitability.
- The company added a record 1 million new members, reached 20.2 million total products, and leverages its national bank charter to fund loans using its own deposits.
- SOFI trades at $20.43, below MA-20, MA-50, and MA-200, with key support near $20.14 and major resistance at $24.53, confirming a bearish technical trend and heightened downside risk.
Revenue growth and record customer gains as institutions boost holdings
SoFi reported strong Q4 2025 results with adjusted net revenue of $1.013 billion, marking a 37% year-over-year increase, and achieved its ninth consecutive quarter of GAAP profitability with EPS of $0.13. The company expanded its customer base by a record 1 million new members, bringing total products to 20.2 million, and strengthened its position in financial services through its national bank charter, enabling it to fund loans using its own deposits. Recent corporate activity included insider transactions, with a director selling shares and exercising options, as well as major institutional holders increasing their positions.
Oversold signals and weak momentum as sellers dominate intraday action
The nearest dynamic support sits below at today’s low near $20.14, while resistance is defined by the Ichimoku Kijun at $24.53. Momentum remains weak, with the MACD signaling a sustained sell bias and the ADX at 17.71 showing a lack of trend strength. RSI on the daily stands at 33.59 and CCI at -85.22 — both indicating oversold conditions, while Bull/Bear Power is firmly negative at -0.48, confirming sellers are in control intraday. The price opened slightly lower than the previous close, producing a narrow gap, and currently sits near the low end of today’s $20.14–$21.00 range. Intraday volatility is elevated, and the tone points to persistent selling pressure after the open, consistent with both momentum and oscillator signals.
High downside risk prevails as volatility anchors range near recent lows
For the coming week, a typical volatility band is projected between $19.00 and $21.00, reflecting recent volatility and current price anchoring. The probability of further price declines is estimated to be very high (more than 80%), with only a low chance of a rebound. The baseline scenario points to sideways movement within this lower range, while a breakout above $24.53 would be needed for a bullish reversal and a drop below $20.00 could expose further downside risk.
Last time, analysts noted that SoFi Technologies remained under persistent downward pressure, trading below all key moving averages with momentum indicators such as MACD and ADX confirming the bearish trend. Oscillators including the RSI and CCI signal oversold conditions, yet there are no indications of a reversal as the stock hovers near immediate support and dynamic resistance remains overhead.


Latest SoFi News


-
 Afghanistan
-
 Albania
-
 Algeria
-
 Angola
-
 Argentina
-
 Armenia
-
 Australia
-
 Austria
-
 Azerbaijan
-
 Bahamas
-
 Bahrain
-
 Bangladesh
-
 Belarus
-
 Belgium
-
 Bolivia
-
 Botswana
-
 Brazil
-
 Brunei
-
 Bulgaria
-
 Cambodia
-
 Cameroon
-
 Canada
-
 Chile
Chile
-
 China
China
-
 Colombia
-
 Congo
Congo
-
 Costa Rica
-
 Cote d'Ivoire
-
 Croatia
-
 Cuba
Cuba
-
 Cyprus
-
 Czechia
-
 DR Congo
-
 Denmark
-
 Dominican Republic
-
 Ecuador
-
 Egypt
Egypt
-
 El Salvador
-
 Estonia
-
 Eswatini
-
 Ethiopia
-
 Finland
-
 France
-
 Georgia
-
 Germany
-
 Ghana
Ghana
-
 Greece
-
 Haiti
Haiti
-
 Hong Kong
-
 Hungary
-
 India
India
-
 Indonesia
-
 Iran, Islamic republic
-
 Iraq
Iraq
-
 Ireland
-
 Israel
-
 Italy
Italy
-
 Jamaica
-
 Japan
Japan
-
 Jordan
-
 Kazakhstan
-
 Kenya
Kenya
-
 Korea
Korea
-
 Kuwait
-
 Kyrgyzstan
-
 Laos
Laos
-
 Latvia
-
 Lebanon
-
 Lesotho
-
 Libya
Libya
-
 Lithuania
-
 Luxembourg
-
 Madagascar
-
 Malaysia
-
 Malta
Malta
-
 Mauritius
-
 Mexico
-
 Moldova
-
 Mongolia
-
 Montenegro
-
 Morocco
-
 Mozambique
-
 Myanmar
-
 Namibia
-
 Nepal
Nepal
-
 Netherlands
-
 New Zealand
-
 Nigeria
-
 North Macedonia
-
 Norway
-
 Oman
Oman
-
 Pakistan
-
 Palestine
-
 Panama
-
 Papua New Guinea
-
 Paraguay
-
 Peru
Peru
-
 Philippines
-
 Poland
-
 Portugal
-
 Puerto Rico
-
 Qatar
Qatar
-
 Reunion
-
 Romania
-
 Rwanda
-
 Saudi Arabia
-
 Serbia
-
 Singapore
-
 Slovakia
-
 Slovenia
-
 Somalia
-
 South Africa
-
 Spain
Spain
-
 Sri Lanka
-
 Sweden
-
 Switzerland
-
 Syria
Syria
-
 Taiwan
-
 Tajikistan
-
 Tanzania
-
 Thailand
-
 Trinidad and Tobago
-
 Tunisia
-
 Turkey
-
 UAE
UAE
-
 Uganda
-
 Ukraine
-
 United Kingdom
-
United States
-
 Uruguay
-
 Uzbekistan
-
 Venezuela
-
 Vietnam
-
 Yemen
Yemen
-
 Zambia
-
 Zimbabwe
- Forex
- Crypto
