
-2.09% for Microsoft stock — sellers press amid heightened volatility and oversold signals

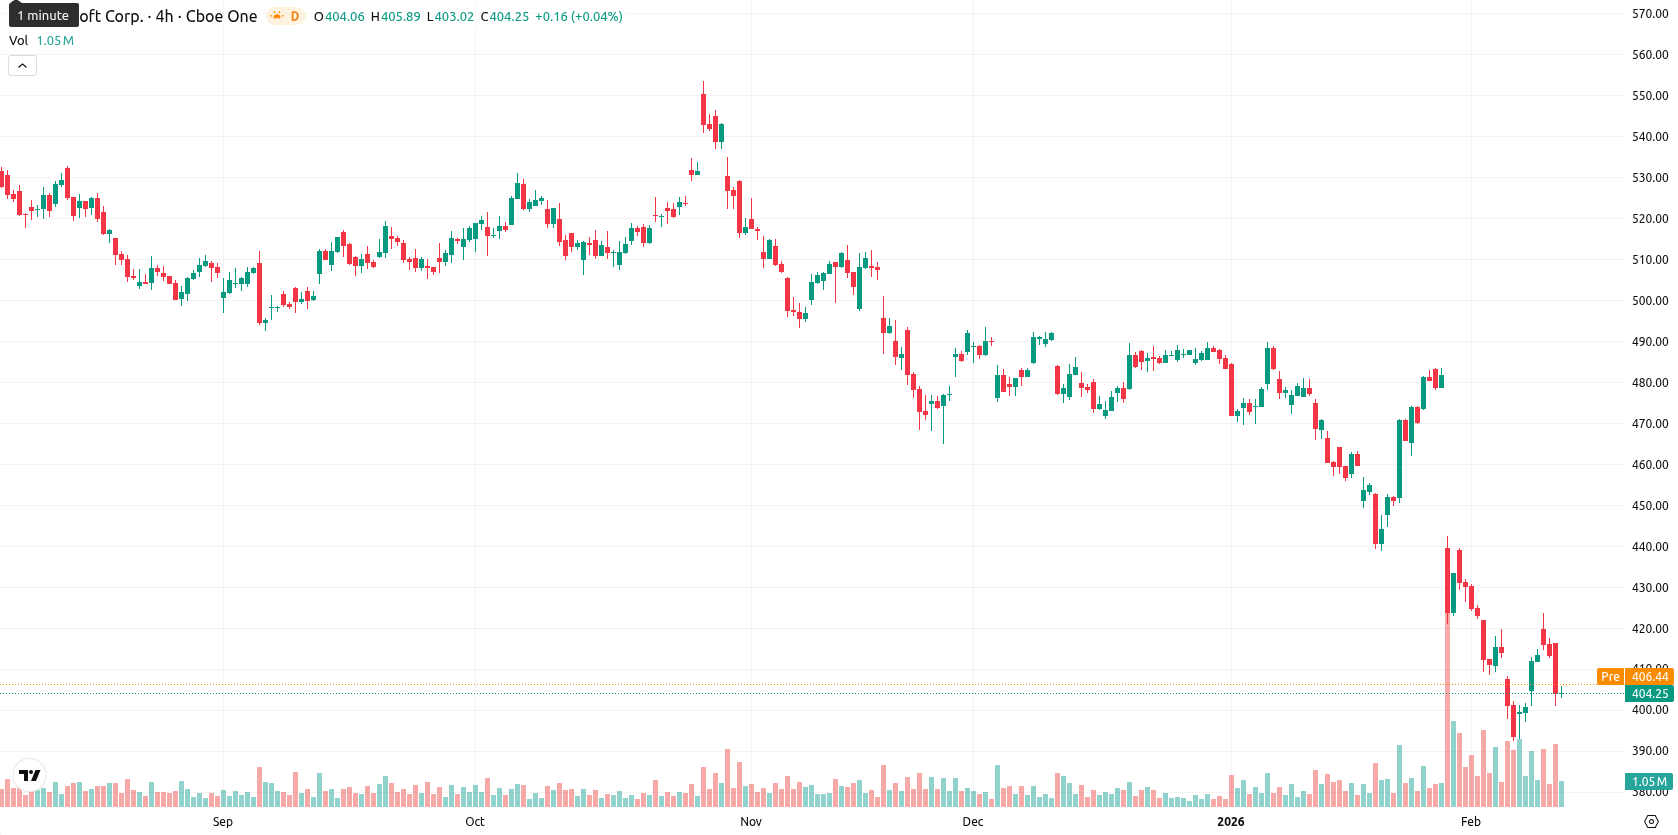
Microsoft Corporation (MSFT) is trading at $404.64, well below its 20-day ($438.18), 50-day ($464.42), and 200-day ($487.29) moving averages, signaling steady downward momentum. The price is also positioned significantly under the Ichimoku Kijun level of $441.01, indicating persistent seller pressure on all timeframes.
Highlights
- Microsoft's fiscal Q2 2026 revenue rose 17% year-over-year to $81.3 billion with non-GAAP EPS of $4.14, exceeding expectations.
- Investor concerns surfaced as Microsoft reported $37.5 billion in AI-related capital expenditures and noted decelerating Azure cloud growth despite robust Copilot adoption.
- Shares are trading at $404.64, well below key moving averages and resistance at $415.00, with technical momentum and indicators pointing to further bearish pressure.
Investor concerns rise amid strong earnings but AI spending weighs
Microsoft reported strong fiscal Q2 2026 results, with revenue growing 17% year-over-year to $81.3 billion and non-GAAP EPS reaching $4.14, both surpassing expectations. However, the results were overshadowed by increased AI-related capital expenditures totaling $37.5 billion and decelerating Azure cloud growth, which raised investor concerns. The company emphasized strong adoption of Microsoft 365 Copilot, new AI and cloud partnerships, and ongoing shareholder returns through dividends and buybacks.
Bearish signals deepen as support erodes and volatility climbs
Momentum indicators remain bearish, with MACD and ADX confirming continued selling pressure and no immediate dynamic support above current levels. RSI sits just above oversold at 33.34, while Stochastic RSI and CCI both signal absent bullish momentum and ongoing selling interest. Bull/Bear Power points to an oversold intraday state, and the session saw a brief gap up at the open before reversing near today’s low, underscoring strong negative momentum amid heightened volatility.
Further declines likely as volatility and resistance limit upside
Over the coming five trading days, MSFT is expected to trade within a typical volatility band of $395.00 to $415.00. The probability for further decline remains extremely high (greater than 80%), with limited chances of recovery. The baseline scenario projects action beneath the $415.00 resistance, while any decisive break above $415.00 and the Kijun would allow a move toward $425.00–$430.00; conversely, a move below $400.00 could open the way to the $395.00 zone.
Previously it was reported that Microsoft shares are trading well below key short-, medium-, and long-term moving averages, with persistent downward momentum confirmed by bearish signals across MACD, ADX, and momentum oscillators. The stock faces immediate resistance at the Ichimoku Kijun level, appears to lack nearby support, and is approaching oversold conditions amid intraday volatility and strong selling pressure.


Latest Microsoft News


-
 Afghanistan
-
 Albania
-
 Algeria
-
 Angola
-
 Argentina
-
 Armenia
-
 Australia
-
 Austria
-
 Azerbaijan
-
 Bahamas
-
 Bahrain
-
 Bangladesh
-
 Belarus
-
 Belgium
-
 Bolivia
-
 Botswana
-
 Brazil
-
 Brunei
-
 Bulgaria
-
 Cambodia
-
 Cameroon
-
 Canada
-
 Chile
Chile
-
 China
China
-
 Colombia
-
 Congo
Congo
-
 Costa Rica
-
 Cote d'Ivoire
-
 Croatia
-
 Cuba
Cuba
-
 Cyprus
-
 Czechia
-
 DR Congo
-
 Denmark
-
 Dominican Republic
-
 Ecuador
-
 Egypt
Egypt
-
 El Salvador
-
 Estonia
-
 Eswatini
-
 Ethiopia
-
 Finland
-
 France
-
 Georgia
-
 Germany
-
 Ghana
Ghana
-
 Greece
-
 Haiti
Haiti
-
 Hong Kong
-
 Hungary
-
 India
India
-
 Indonesia
-
 Iran, Islamic republic
-
 Iraq
Iraq
-
 Ireland
-
 Israel
-
 Italy
Italy
-
 Jamaica
-
 Japan
Japan
-
 Jordan
-
 Kazakhstan
-
 Kenya
Kenya
-
 Korea
Korea
-
 Kuwait
-
 Kyrgyzstan
-
 Laos
Laos
-
 Latvia
-
 Lebanon
-
 Lesotho
-
 Libya
Libya
-
 Lithuania
-
 Luxembourg
-
 Madagascar
-
 Malaysia
-
 Malta
Malta
-
 Mauritius
-
 Mexico
-
 Moldova
-
 Mongolia
-
 Montenegro
-
 Morocco
-
 Mozambique
-
 Myanmar
-
 Namibia
-
 Nepal
Nepal
-
 Netherlands
-
 New Zealand
-
 Nigeria
-
 North Macedonia
-
 Norway
-
 Oman
Oman
-
 Pakistan
-
 Palestine
-
 Panama
-
 Papua New Guinea
-
 Paraguay
-
 Peru
Peru
-
 Philippines
-
 Poland
-
 Portugal
-
 Puerto Rico
-
 Qatar
Qatar
-
 Reunion
-
 Romania
-
 Rwanda
-
 Saudi Arabia
-
 Serbia
-
 Singapore
-
 Slovakia
-
 Slovenia
-
 Somalia
-
 South Africa
-
 Spain
Spain
-
 Sri Lanka
-
 Sweden
-
 Switzerland
-
 Syria
Syria
-
 Taiwan
-
 Tajikistan
-
 Tanzania
-
 Thailand
-
 Trinidad and Tobago
-
 Tunisia
-
 Turkey
-
 UAE
UAE
-
 Uganda
-
 Ukraine
-
 United Kingdom
-
United States
-
 Uruguay
-
 Uzbekistan
-
 Venezuela
-
 Vietnam
-
 Yemen
Yemen
-
 Zambia
-
 Zimbabwe
- Forex
- Crypto
