
Consolidation for AMD stock — uncertainty remains with sideways action forecast

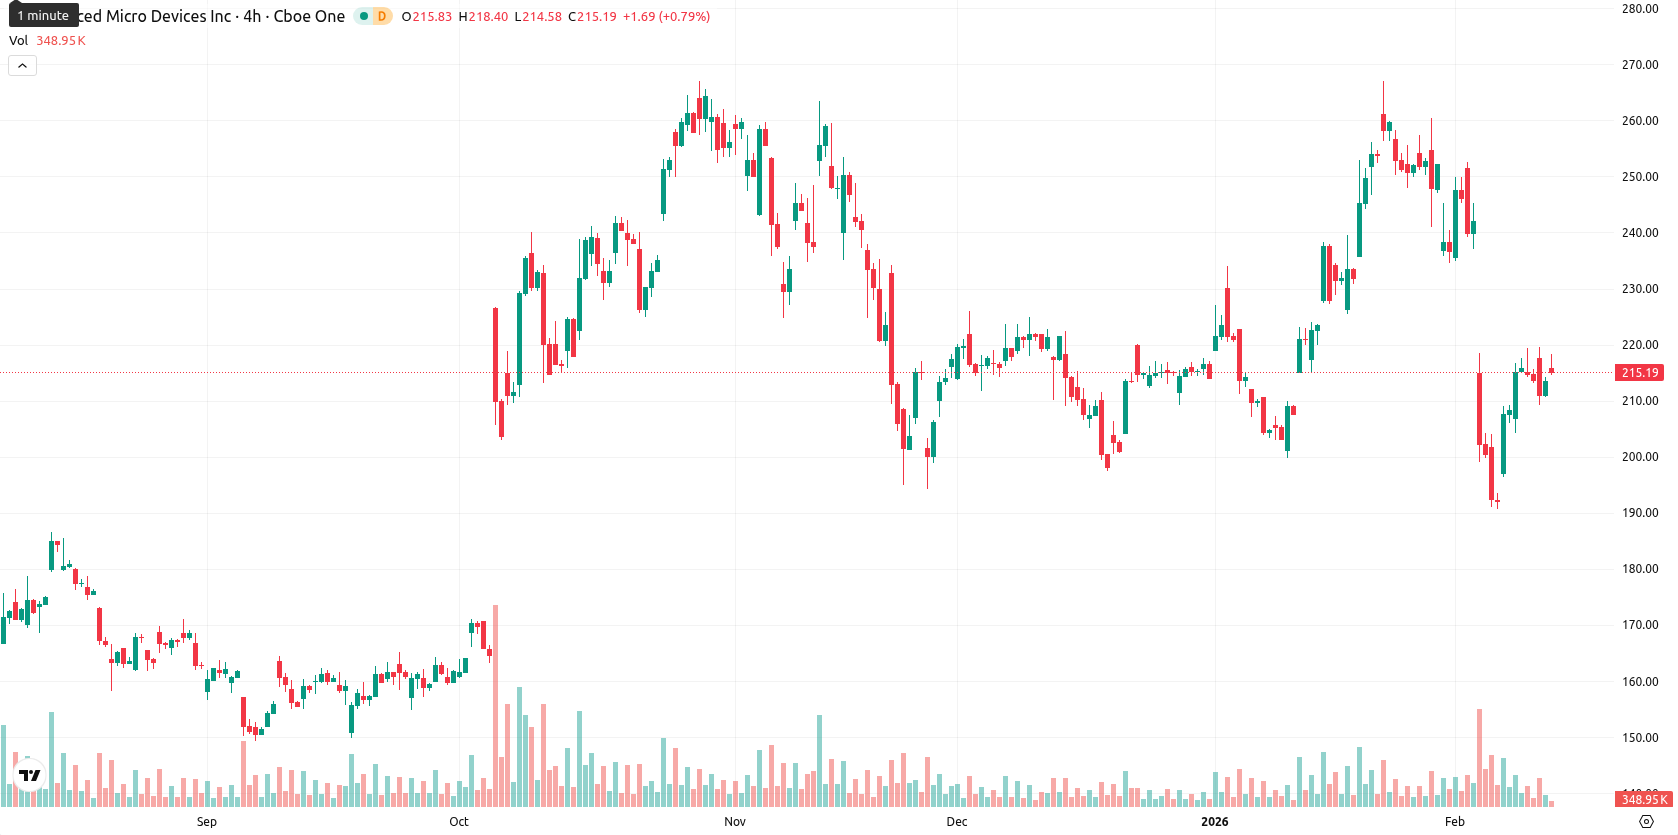
Advanced Micro Devices, Inc. (AMD) is trading at $214.00, which is below both the MA-20 ($232.81) and MA-50 ($221.58), but remains well above the MA-200 ($180.84). This setup suggests lingering short- to medium-term pressure from sellers while the long-term trend is still bullish; the nearest dynamic resistance is the Ichimoku Kijun at $228.81, with support forming near the MA-200.
Highlights
- AMD trades at $214.00, below its MA-20 ($232.81) and MA-50 ($221.58), indicating persistent short- to medium-term selling pressure.
- Key oscillators, including an RSI at 44.24 with a Sell forecast and negative CCI, point to oversold or seller-dominated conditions and weak momentum.
- Expected five-day trading range is $210.35 to $218.17; a breakout above $218.17 signals a resumed uptrend, while $210.35–$180.84 offers key downside support.
Weak daily momentum and diverging signals heighten short-term uncertainty
Momentum on the daily chart is weak, as shown by a declining MACD and a low, neutral ADX. Most oscillators point to oversold or seller-dominated conditions — RSI is at 44.24 with a Sell forecast, Stochastic RSI is neutral but near oversold, CCI remains negative, and Bull/Bear Power indicates clear intraday seller dominance. The Awesome Oscillator is neutral and does not strengthen the dominant trend. Today’s session opened with a small upward gap ($215.79 versus the previous close of $213.58), but the price has hovered near the lower-middle of its daily range. Intraday volatility has been modest, and the market shows little upward momentum after the open, reflecting a mild consolidation phase; several oscillators and momentum signals diverge, underlining uncertainty in the short term.
Sideways outlook favored as weekly momentum tempers downside risk
For the next five trading days, the expected trading corridor is $210.35 to $218.17, which fits within a typical volatility band relative to current levels. Based on the strong positive readings in weekly momentum indicators (RSI, ADX, MACD, and the weekly MA-50), there is a very high probability (more than 80%) of stabilization or further gains, while downside risk is comparatively low. The baseline scenario is that AMD continues to move sideways between support at $210.35 and resistance at $218.17. A bullish breakout above $218.17 would confirm a resumption of the uptrend, while a bearish decline below $210.35 could trigger deeper short-term selling before long-term support at the MA-200 provides a buffer.
Last time, analysts noted that AMD was trading below its short- and medium-term moving averages but remains well above its long-term average, indicating ongoing short-term selling pressure within a positive long-term trend. Momentum indicators are mixed and reflect mild oversold conditions with consolidation likely in the near term, while support levels remain intact and the probability of a near-term upward move is elevated unless key support is breached.


Latest AMD News


-
 Afghanistan
-
 Albania
-
 Algeria
-
 Angola
-
 Argentina
-
 Armenia
-
 Australia
-
 Austria
-
 Azerbaijan
-
 Bahamas
-
 Bahrain
-
 Bangladesh
-
 Belarus
-
 Belgium
-
 Bolivia
-
 Botswana
-
 Brazil
-
 Brunei
-
 Bulgaria
-
 Cambodia
-
 Cameroon
-
 Canada
-
 Chile
Chile
-
 China
China
-
 Colombia
-
 Congo
Congo
-
 Costa Rica
-
 Cote d'Ivoire
-
 Croatia
-
 Cuba
Cuba
-
 Cyprus
-
 Czechia
-
 DR Congo
-
 Denmark
-
 Dominican Republic
-
 Ecuador
-
 Egypt
Egypt
-
 El Salvador
-
 Estonia
-
 Eswatini
-
 Ethiopia
-
 Finland
-
 France
-
 Georgia
-
 Germany
-
 Ghana
Ghana
-
 Greece
-
 Haiti
Haiti
-
 Hong Kong
-
 Hungary
-
 India
India
-
 Indonesia
-
 Iran, Islamic republic
-
 Iraq
Iraq
-
 Ireland
-
 Israel
-
 Italy
Italy
-
 Jamaica
-
 Japan
Japan
-
 Jordan
-
 Kazakhstan
-
 Kenya
Kenya
-
 Korea
Korea
-
 Kuwait
-
 Kyrgyzstan
-
 Laos
Laos
-
 Latvia
-
 Lebanon
-
 Lesotho
-
 Libya
Libya
-
 Lithuania
-
 Luxembourg
-
 Madagascar
-
 Malaysia
-
 Malta
Malta
-
 Mauritius
-
 Mexico
-
 Moldova
-
 Mongolia
-
 Montenegro
-
 Morocco
-
 Mozambique
-
 Myanmar
-
 Namibia
-
 Nepal
Nepal
-
 Netherlands
-
 New Zealand
-
 Nigeria
-
 North Macedonia
-
 Norway
-
 Oman
Oman
-
 Pakistan
-
 Palestine
-
 Panama
-
 Papua New Guinea
-
 Paraguay
-
 Peru
Peru
-
 Philippines
-
 Poland
-
 Portugal
-
 Puerto Rico
-
 Qatar
Qatar
-
 Reunion
-
 Romania
-
 Rwanda
-
 Saudi Arabia
-
 Serbia
-
 Singapore
-
 Slovakia
-
 Slovenia
-
 Somalia
-
 South Africa
-
 Spain
Spain
-
 Sri Lanka
-
 Sweden
-
 Switzerland
-
 Syria
Syria
-
 Taiwan
-
 Tajikistan
-
 Tanzania
-
 Thailand
-
 Trinidad and Tobago
-
 Tunisia
-
 Turkey
-
 UAE
UAE
-
 Uganda
-
 Ukraine
-
 United Kingdom
-
United States
-
 Uruguay
-
 Uzbekistan
-
 Venezuela
-
 Vietnam
-
 Yemen
Yemen
-
 Zambia
-
 Zimbabwe
- Forex
- Crypto
