
AMD stock: Modest uptick as strong earnings clash with short-term seller pressure

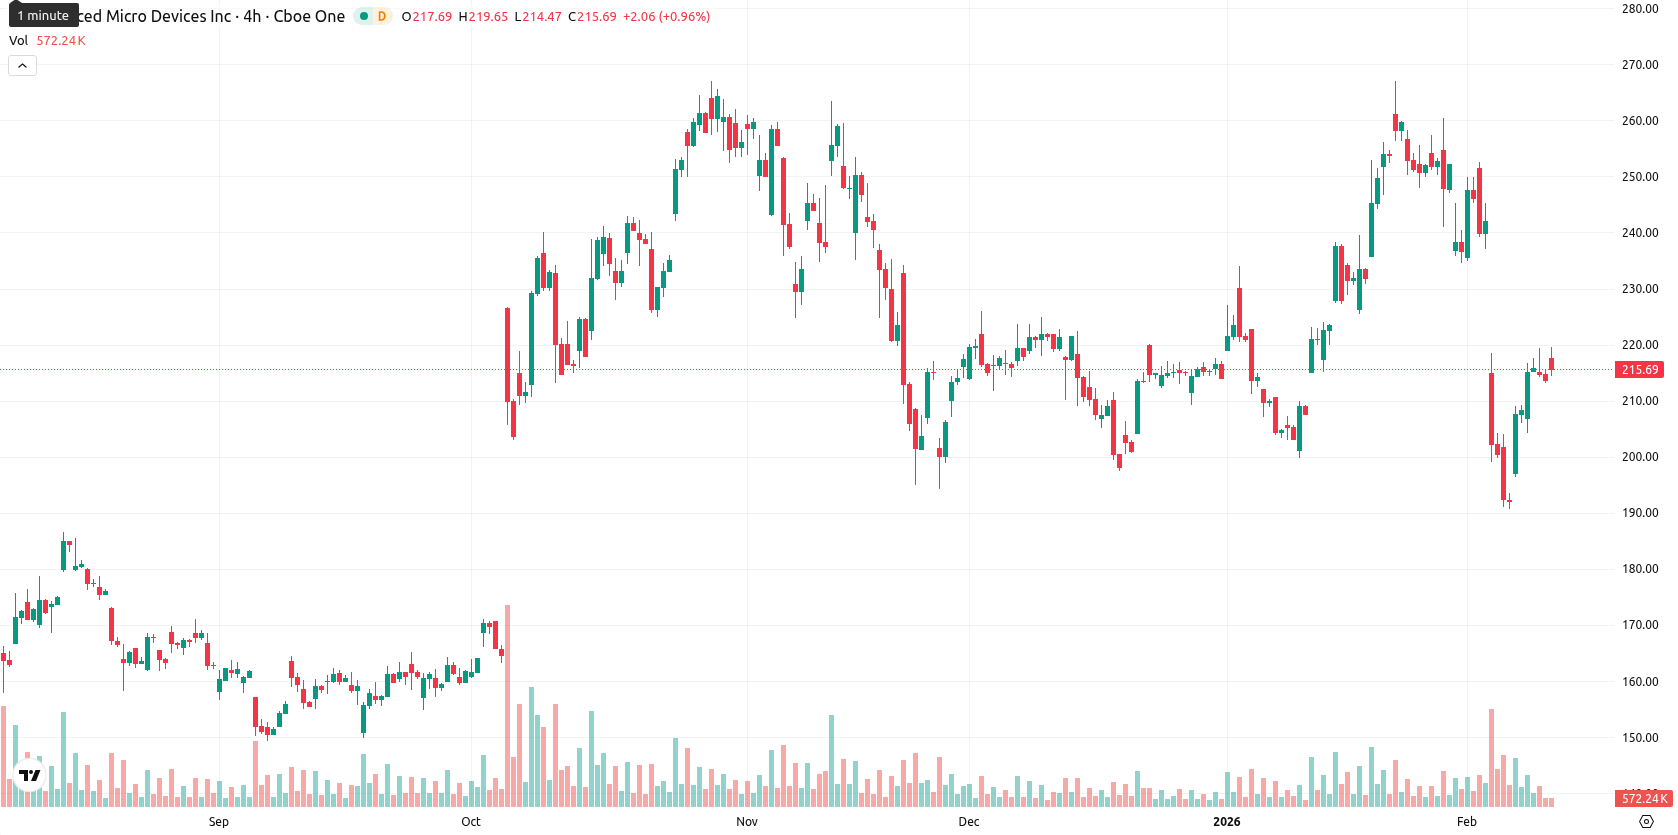
Advanced Micro Devices (AMD) is trading at $216.90, which sits below both the MA-20 ($233.18) and MA-50 ($221.65) but well above the MA-200 ($180.26), indicating ongoing short- and medium-term pressure from sellers while the long-term trend remains positive. The Ichimoku Kijun at $228.81 acts as the nearest dynamic resistance, while the MA-200 continues to provide a wide cushion of long-term support.
Highlights
- AMD posted strong Q4 earnings and robust revenue growth driven by demand for Instinct MI350 Series GPUs and EPYC server chips.
- Management guided for cautious Q1 results due to anticipated seasonal weakness, but noted data center segment revenue growth and a $1 trillion addressable market by 2030.
- AMD trades at $216.90, below key short-term moving averages and faces resistance at $228.81, with expected consolidation in the $210.50–$218.50 range over the next week.
Earnings beat dampened by cautious outlook and seasonal demand risks
AMD reported strong earnings and revenue growth in its latest Q4 release, but a cautious Q1 outlook coupled with concerns about seasonal weakness weighed on sentiment. The company highlighted robust demand for its Instinct MI350 Series GPUs and ongoing adoption of its fourth and fifth-generation EPYC server chips. Management also pointed to significant revenue growth in the data center segment, and projected the total addressable market for data centers could reach $1 trillion by 2030.
Mixed momentum clouded by oscillators’ divergence and intraday volatility
Momentum signals are mixed, with the MACD on the daily chart showing a neutral stance and the ADX indicating a weak trend. Oscillators such as the RSI (44.20), Stochastic RSI, and CCI all point to mild oversold conditions, and Bull/Bear Power indicates clear intraday seller dominance with an "Oversold" reading. Notably, the daily session opened higher with a gap up from the previous close (from $213.57 to $217.61) and the current price is holding near the middle of today’s trading range, suggesting moderate intraday volatility and a tone of sideways consolidation after initial strength. The Awesome Oscillator suggests selling pressure, which aligns with the generally bearish momentum, but divergence among oscillators highlights uncertainty in the intraday bias.
Sideways consolidation likely as upward move probability climbs
For the next 5 trading days, the expected price range is $210.50 to $218.50, reflecting a volatility band relative to current levels. The probability of an upward move is high — more than 80% — given strong weekly signals from the MA-50, RSI, ADX, and MACD, making a downward move much less likely in the short term. Baseline scenario: AMD consolidates sideways within this range. In a bullish scenario, a close above $228.80 (Ichimoku Kijun) would open the path for a gradual recovery toward higher resistances, while failure to hold above the $210.50–$213.00 support zone could signal renewed selling, though a robust long-term trend should limit deeper declines.
Last time, analysts noted that Advanced Micro Devices, Inc. was trading below its short- and medium-term moving averages but well above its long-term average, indicating near-term seller pressure within an overall bullish structure. Despite mixed momentum signals—such as a mild bearish bias from RSI and oversold indicators—weekly trend signals remain strongly bullish, suggesting high odds of a near-term upward move unless support at $212.66 is breached.


Latest AMD News


-
 Afghanistan
-
 Albania
-
 Algeria
-
 Angola
-
 Argentina
-
 Armenia
-
 Australia
-
 Austria
-
 Azerbaijan
-
 Bahamas
-
 Bahrain
-
 Bangladesh
-
 Belarus
-
 Belgium
-
 Bolivia
-
 Botswana
-
 Brazil
-
 Brunei
-
 Bulgaria
-
 Cambodia
-
 Cameroon
-
 Canada
-
 Chile
Chile
-
 China
China
-
 Colombia
-
 Congo
Congo
-
 Costa Rica
-
 Cote d'Ivoire
-
 Croatia
-
 Cuba
Cuba
-
 Cyprus
-
 Czechia
-
 DR Congo
-
 Denmark
-
 Dominican Republic
-
 Ecuador
-
 Egypt
Egypt
-
 El Salvador
-
 Estonia
-
 Eswatini
-
 Ethiopia
-
 Finland
-
 France
-
 Georgia
-
 Germany
-
 Ghana
Ghana
-
 Greece
-
 Haiti
Haiti
-
 Hong Kong
-
 Hungary
-
 India
India
-
 Indonesia
-
 Iran, Islamic republic
-
 Iraq
Iraq
-
 Ireland
-
 Israel
-
 Italy
Italy
-
 Jamaica
-
 Japan
Japan
-
 Jordan
-
 Kazakhstan
-
 Kenya
Kenya
-
 Korea
Korea
-
 Kuwait
-
 Kyrgyzstan
-
 Laos
Laos
-
 Latvia
-
 Lebanon
-
 Lesotho
-
 Libya
Libya
-
 Lithuania
-
 Luxembourg
-
 Madagascar
-
 Malaysia
-
 Malta
Malta
-
 Mauritius
-
 Mexico
-
 Moldova
-
 Mongolia
-
 Montenegro
-
 Morocco
-
 Mozambique
-
 Myanmar
-
 Namibia
-
 Nepal
Nepal
-
 Netherlands
-
 New Zealand
-
 Nigeria
-
 North Macedonia
-
 Norway
-
 Oman
Oman
-
 Pakistan
-
 Palestine
-
 Panama
-
 Papua New Guinea
-
 Paraguay
-
 Peru
Peru
-
 Philippines
-
 Poland
-
 Portugal
-
 Puerto Rico
-
 Qatar
Qatar
-
 Reunion
-
 Romania
-
 Rwanda
-
 Saudi Arabia
-
 Serbia
-
 Singapore
-
 Slovakia
-
 Slovenia
-
 Somalia
-
 South Africa
-
 Spain
Spain
-
 Sri Lanka
-
 Sweden
-
 Switzerland
-
 Syria
Syria
-
 Taiwan
-
 Tajikistan
-
 Tanzania
-
 Thailand
-
 Trinidad and Tobago
-
 Tunisia
-
 Turkey
-
 UAE
UAE
-
 Uganda
-
 Ukraine
-
 United Kingdom
-
United States
-
 Uruguay
-
 Uzbekistan
-
 Venezuela
-
 Vietnam
-
 Yemen
Yemen
-
 Zambia
-
 Zimbabwe
- Forex
- Crypto
