
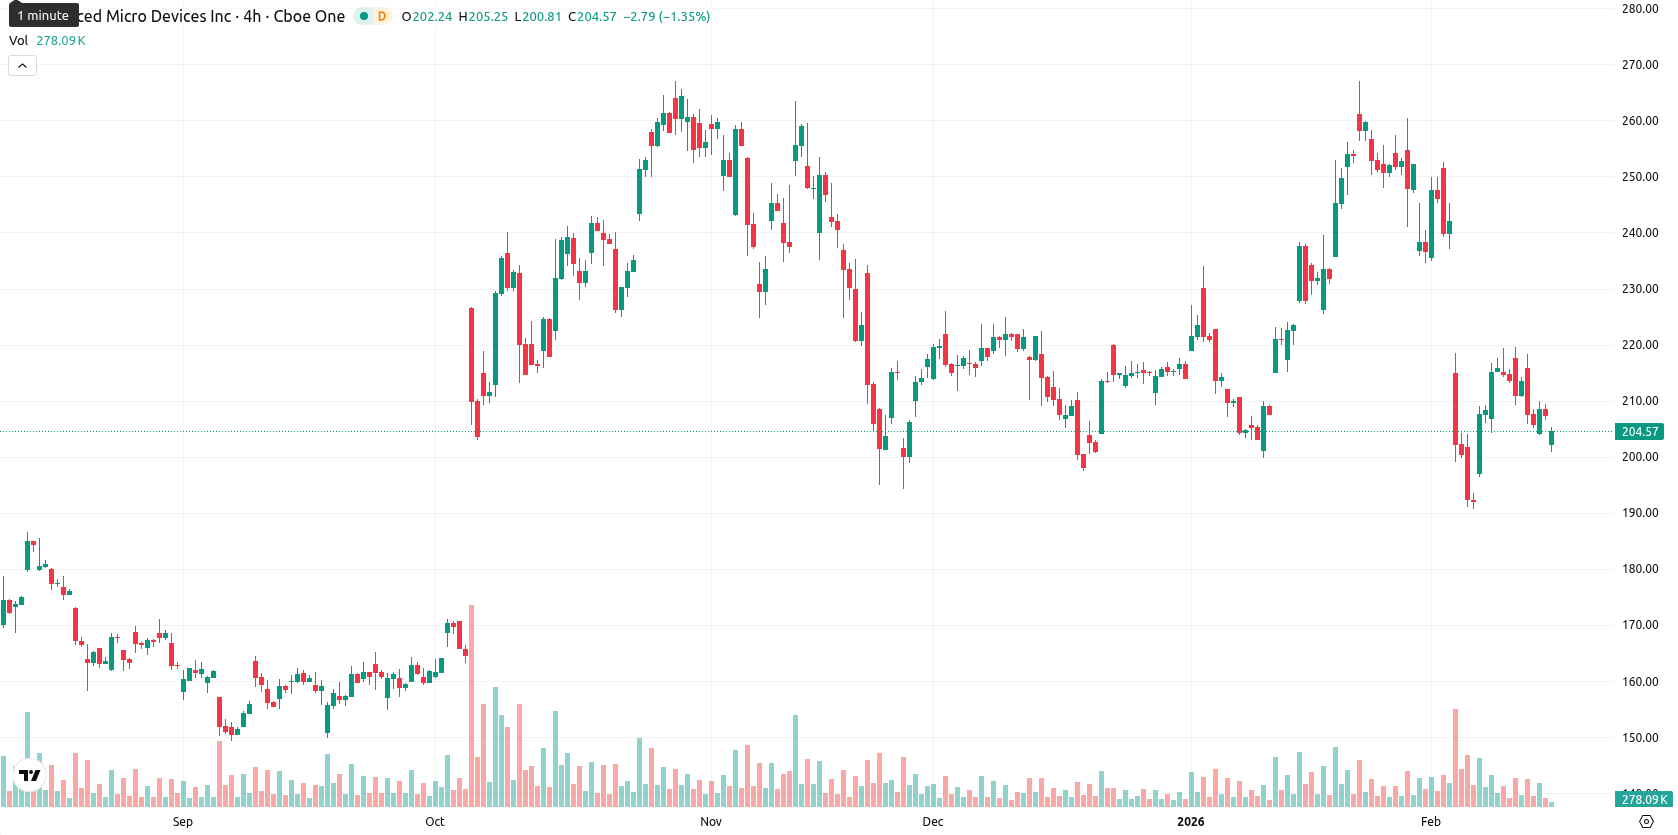
Bearish technical signals persist — AMD stock slips 3.06%

Advanced Micro Devices, Inc. (AMD) is trading at $200.97, placing it well below the MA-20 ($230.89) and MA-50 ($221.14), but still above the MA-200 ($181.94). This reflects persistent short- and medium-term selling pressure, with long-term support intact around the MA-200, while the nearest resistance remains the Ichimoku Kijun at $228.81.
Highlights
- AMD is trading at $200.97, sitting below the MA-20 ($230.89) and MA-50 ($221.14) but above long-term MA-200 support at $181.94.
- Technical momentum is bearish with weak MACD, RSI, and ADX (16.19), plus oscillators and Bull/Bear Power indicating oversold, seller-dominated conditions.
- For the next five trading days, AMD is expected to consolidate between $190 and $210, with upside above $210 targeting $220–$228, downside risk to $181.
Bearish momentum aligns as oversold signals and sellers lead intraday
Momentum remains weak, with the MACD and RSI both signaling a bearish bias and ADX at 16.19 indicating a lack of strong trend direction. Multiple oscillators including Stochastic RSI and CCI show oversold or near-oversold conditions, while Bull/Bear Power is notably oversold, highlighting seller dominance intraday. The daily session opened with a downward gap from $207.32 to $202.20 and continued to slip to $200.97, currently trading near the lower end of today’s range amid moderate volatility and sustained downside pressure since the open. There is a clear alignment between the prevailing intraday weakness and the overall bearish momentum from technical signals.
Downside risk elevated as consolidation expected within revised range
For the next five trading days, the expected price range is adjusted to $190–$210 to reflect typical weekly volatility while keeping the current price between support and resistance. Based on the prevailing signals across weekly indicators, the probability of a price increase is less likely (very low probability, less than 20%), with the chances of further decline much higher. Baseline scenario: AMD consolidates between $190 and $210, finding support but struggling for upside. Bullish scenario: a close above $210 could target the $220–$228 area. Bearish scenario: a break below $190 may trigger a test of the $181 support region.
Last time, analysts noted that Advanced Micro Devices is trading below its short- and medium-term moving averages with persistent seller dominance, while remaining above key long-term support levels. Momentum indicators such as the RSI and MACD signal bearish short-term sentiment and continued consolidation is expected between support near $200 and resistance above $215, barring a decisive breakout.


Latest AMD News


-
 Afghanistan
-
 Albania
-
 Algeria
-
 Angola
-
 Argentina
-
 Armenia
-
 Australia
-
 Austria
-
 Azerbaijan
-
 Bahamas
-
 Bahrain
-
 Bangladesh
-
 Belarus
-
 Belgium
-
 Bolivia
-
 Botswana
-
 Brazil
-
 Brunei
-
 Bulgaria
-
 Cambodia
-
 Cameroon
-
 Canada
-
 Chile
Chile
-
 China
China
-
 Colombia
-
 Congo
Congo
-
 Costa Rica
-
 Cote d'Ivoire
-
 Croatia
-
 Cuba
Cuba
-
 Cyprus
-
 Czechia
-
 DR Congo
-
 Denmark
-
 Dominican Republic
-
 Ecuador
-
 Egypt
Egypt
-
 El Salvador
-
 Estonia
-
 Eswatini
-
 Ethiopia
-
 Finland
-
 France
-
 Georgia
-
 Germany
-
 Ghana
Ghana
-
 Greece
-
 Haiti
Haiti
-
 Hong Kong
-
 Hungary
-
 India
India
-
 Indonesia
-
 Iran, Islamic republic
-
 Iraq
Iraq
-
 Ireland
-
 Israel
-
 Italy
Italy
-
 Jamaica
-
 Japan
Japan
-
 Jordan
-
 Kazakhstan
-
 Kenya
Kenya
-
 Korea
Korea
-
 Kuwait
-
 Kyrgyzstan
-
 Laos
Laos
-
 Latvia
-
 Lebanon
-
 Lesotho
-
 Libya
Libya
-
 Lithuania
-
 Luxembourg
-
 Madagascar
-
 Malaysia
-
 Malta
Malta
-
 Mauritius
-
 Mexico
-
 Moldova
-
 Mongolia
-
 Montenegro
-
 Morocco
-
 Mozambique
-
 Myanmar
-
 Namibia
-
 Nepal
Nepal
-
 Netherlands
-
 New Zealand
-
 Nigeria
-
 North Macedonia
-
 Norway
-
 Oman
Oman
-
 Pakistan
-
 Palestine
-
 Panama
-
 Papua New Guinea
-
 Paraguay
-
 Peru
Peru
-
 Philippines
-
 Poland
-
 Portugal
-
 Puerto Rico
-
 Qatar
Qatar
-
 Reunion
-
 Romania
-
 Rwanda
-
 Saudi Arabia
-
 Serbia
-
 Singapore
-
 Slovakia
-
 Slovenia
-
 Somalia
-
 South Africa
-
 Spain
Spain
-
 Sri Lanka
-
 Sweden
-
 Switzerland
-
 Syria
Syria
-
 Taiwan
-
 Tajikistan
-
 Tanzania
-
 Thailand
-
 Trinidad and Tobago
-
 Tunisia
-
 Turkey
-
 UAE
UAE
-
 Uganda
-
 Ukraine
-
 United Kingdom
-
United States
-
 Uruguay
-
 Uzbekistan
-
 Venezuela
-
 Vietnam
-
 Yemen
Yemen
-
 Zambia
-
 Zimbabwe
- Forex
- Crypto
