
-1.17% for Alphabet stock — fresh selling follows gap-down and resistance at $322

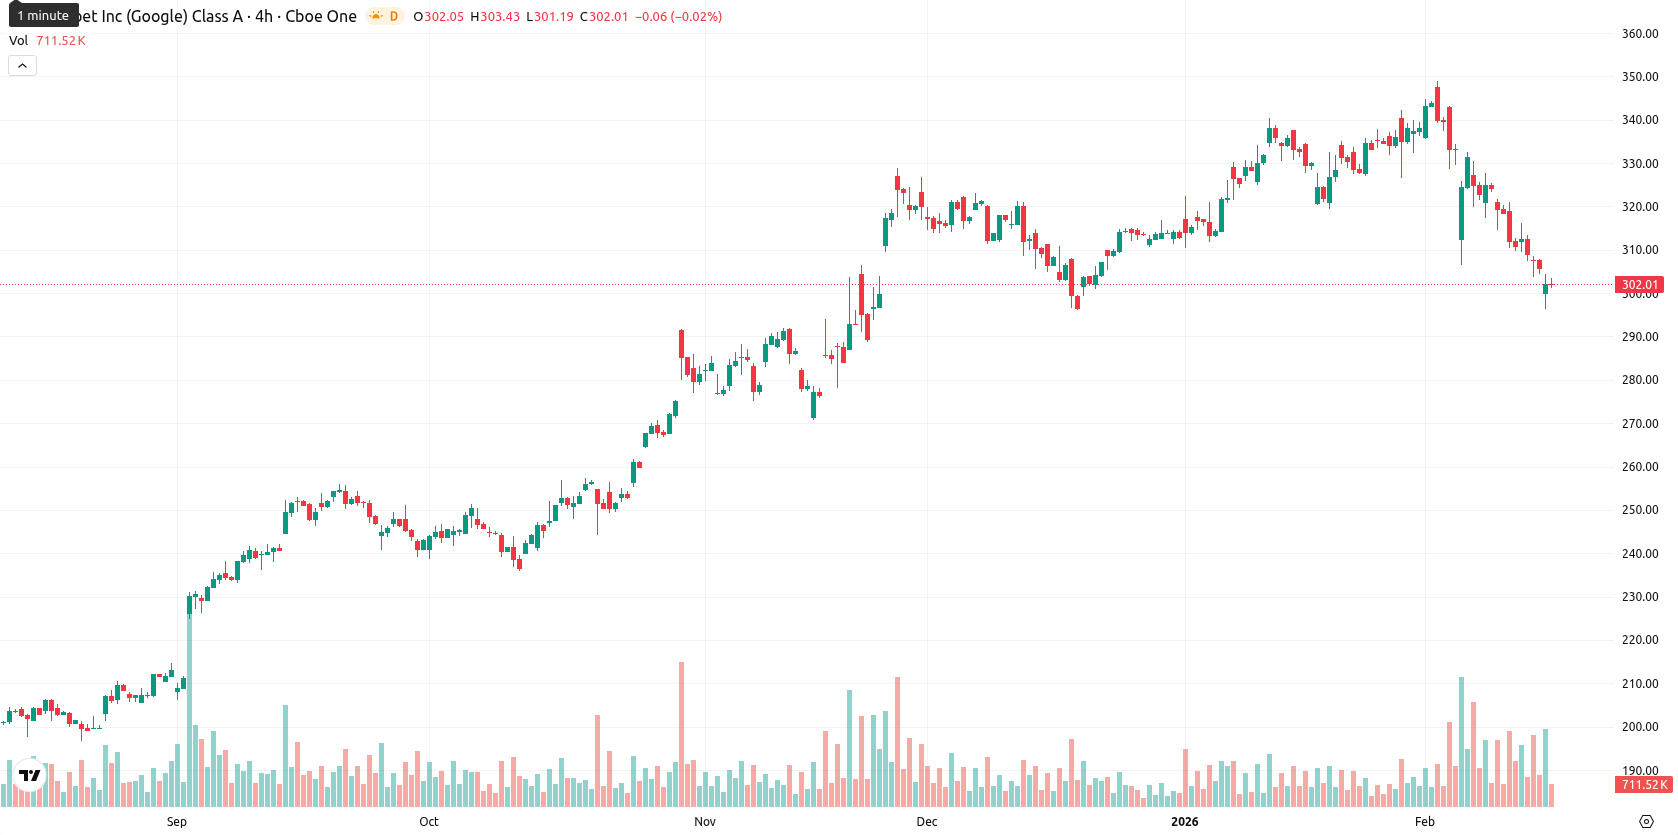
Alphabet Inc. (GOOGL) is trading at $302.02, remaining below both the MA-20 ($326.53) and MA-50 ($320.88), suggesting ongoing short- and medium-term downside pressure. The price stays well above the MA-200 ($243.57), indicating intact long-term support, while the Ichimoku Kijun at $322.65 acts as the nearest dynamic resistance.
Highlights
- Alphabet reported Q4 revenue of $113.83 billion, up 18% year-over-year with a net margin of 32.81%, surpassing analyst expectations.
- Alphabet secured unconditional EU approval for its $32 billion acquisition of cybersecurity firm Wiz, its largest deal to date.
- GOOGL trades at $302.02, below MA-20 and MA-50, with bearish daily momentum and key resistance at $322–$325; $296 marks critical near-term support.
Earnings and deal approvals fuel positive sentiment despite insider sale
Alphabet reported strong fourth-quarter earnings, with revenue up 18% year-over-year to $113.83 billion, surpassing analysts' estimates and delivering a net margin of 32.81%. The company announced a quarterly dividend, payable on March 16, 2026, and secured unconditional EU antitrust approval for its $32 billion acquisition of cybersecurity firm Wiz, marking its largest deal to date. In addition, Alphabet's AI assistant Gemini passed 750 million monthly active users, while YouTube's annual revenue from ads and subscriptions exceeded $60 billion. Director John L. Hennessy also made a notable insider share sale of 590 shares.
Bearish momentum intensifies as price tests daily range mid-point
Momentum signals on the daily timeframe continue to point lower, with both the MACD and ADX indicating bearish momentum. Oversold conditions are observed across RSI (29.74), Stochastic RSI, and CCI, with Bull/Bear Power confirming persistent seller dominance intraday. The Awesome Oscillator supports the downtrend. The stock opened with a gap down from $305.60 to $299.05 and currently trades near the middle of a $296.30 – $304.27 daily range, showing a 1.17% loss for the session. Volatility remains moderate amid steady post-open downside pressure, aligning intraday performance with momentum signals and supporting the case for continued weakness.
Sideways base case set as upside potential hinges on resistance reclaim
Over the next five trading days, GOOGL is expected to move within a typical volatility band of $296 to $314. Weekly indicators point to a high probability (over 80%) of an upward move, while a decline appears much less likely. The base case anticipates sideways trading inside this range. A bullish scenario would emerge if GOOGL reclaims the $322 – $325 resistance area, while a sustained break below $296 could signal further downside toward longer-term moving averages.
Previously it was reported that Alphabet Inc. is trading below its short- and medium-term moving averages, reflecting ongoing selling pressure, while continuing to hold above its long-term average. Technical indicators including RSI, CCI, and Stochastic RSI indicate oversold conditions, with immediate resistance near $326 and broad support from the long-term moving average, suggesting limited rebound potential and a likely continuation of sideways to slightly lower trading.


Latest Google News


-
 Afghanistan
-
 Albania
-
 Algeria
-
 Angola
-
 Argentina
-
 Armenia
-
 Australia
-
 Austria
-
 Azerbaijan
-
 Bahamas
-
 Bahrain
-
 Bangladesh
-
 Belarus
-
 Belgium
-
 Bolivia
-
 Botswana
-
 Brazil
-
 Brunei
-
 Bulgaria
-
 Cambodia
-
 Cameroon
-
 Canada
-
 Chile
Chile
-
 China
China
-
 Colombia
-
 Congo
Congo
-
 Costa Rica
-
 Cote d'Ivoire
-
 Croatia
-
 Cuba
Cuba
-
 Cyprus
-
 Czechia
-
 DR Congo
-
 Denmark
-
 Dominican Republic
-
 Ecuador
-
 Egypt
Egypt
-
 El Salvador
-
 Estonia
-
 Eswatini
-
 Ethiopia
-
 Finland
-
 France
-
 Georgia
-
 Germany
-
 Ghana
Ghana
-
 Greece
-
 Haiti
Haiti
-
 Hong Kong
-
 Hungary
-
 India
India
-
 Indonesia
-
 Iran, Islamic republic
-
 Iraq
Iraq
-
 Ireland
-
 Israel
-
 Italy
Italy
-
 Jamaica
-
 Japan
Japan
-
 Jordan
-
 Kazakhstan
-
 Kenya
Kenya
-
 Korea
Korea
-
 Kuwait
-
 Kyrgyzstan
-
 Laos
Laos
-
 Latvia
-
 Lebanon
-
 Lesotho
-
 Libya
Libya
-
 Lithuania
-
 Luxembourg
-
 Madagascar
-
 Malaysia
-
 Malta
Malta
-
 Mauritius
-
 Mexico
-
 Moldova
-
 Mongolia
-
 Montenegro
-
 Morocco
-
 Mozambique
-
 Myanmar
-
 Namibia
-
 Nepal
Nepal
-
 Netherlands
-
 New Zealand
-
 Nigeria
-
 North Macedonia
-
 Norway
-
 Oman
Oman
-
 Pakistan
-
 Palestine
-
 Panama
-
 Papua New Guinea
-
 Paraguay
-
 Peru
Peru
-
 Philippines
-
 Poland
-
 Portugal
-
 Puerto Rico
-
 Qatar
Qatar
-
 Reunion
-
 Romania
-
 Rwanda
-
 Saudi Arabia
-
 Serbia
-
 Singapore
-
 Slovakia
-
 Slovenia
-
 Somalia
-
 South Africa
-
 Spain
Spain
-
 Sri Lanka
-
 Sweden
-
 Switzerland
-
 Syria
Syria
-
 Taiwan
-
 Tajikistan
-
 Tanzania
-
 Thailand
-
 Trinidad and Tobago
-
 Tunisia
-
 Turkey
-
 UAE
UAE
-
 Uganda
-
 Ukraine
-
 United Kingdom
-
United States
-
 Uruguay
-
 Uzbekistan
-
 Venezuela
-
 Vietnam
-
 Yemen
Yemen
-
 Zambia
-
 Zimbabwe
- Forex
- Crypto
