
U.S. Supreme Court tariff ruling — Alphabet stock gains 4.34%

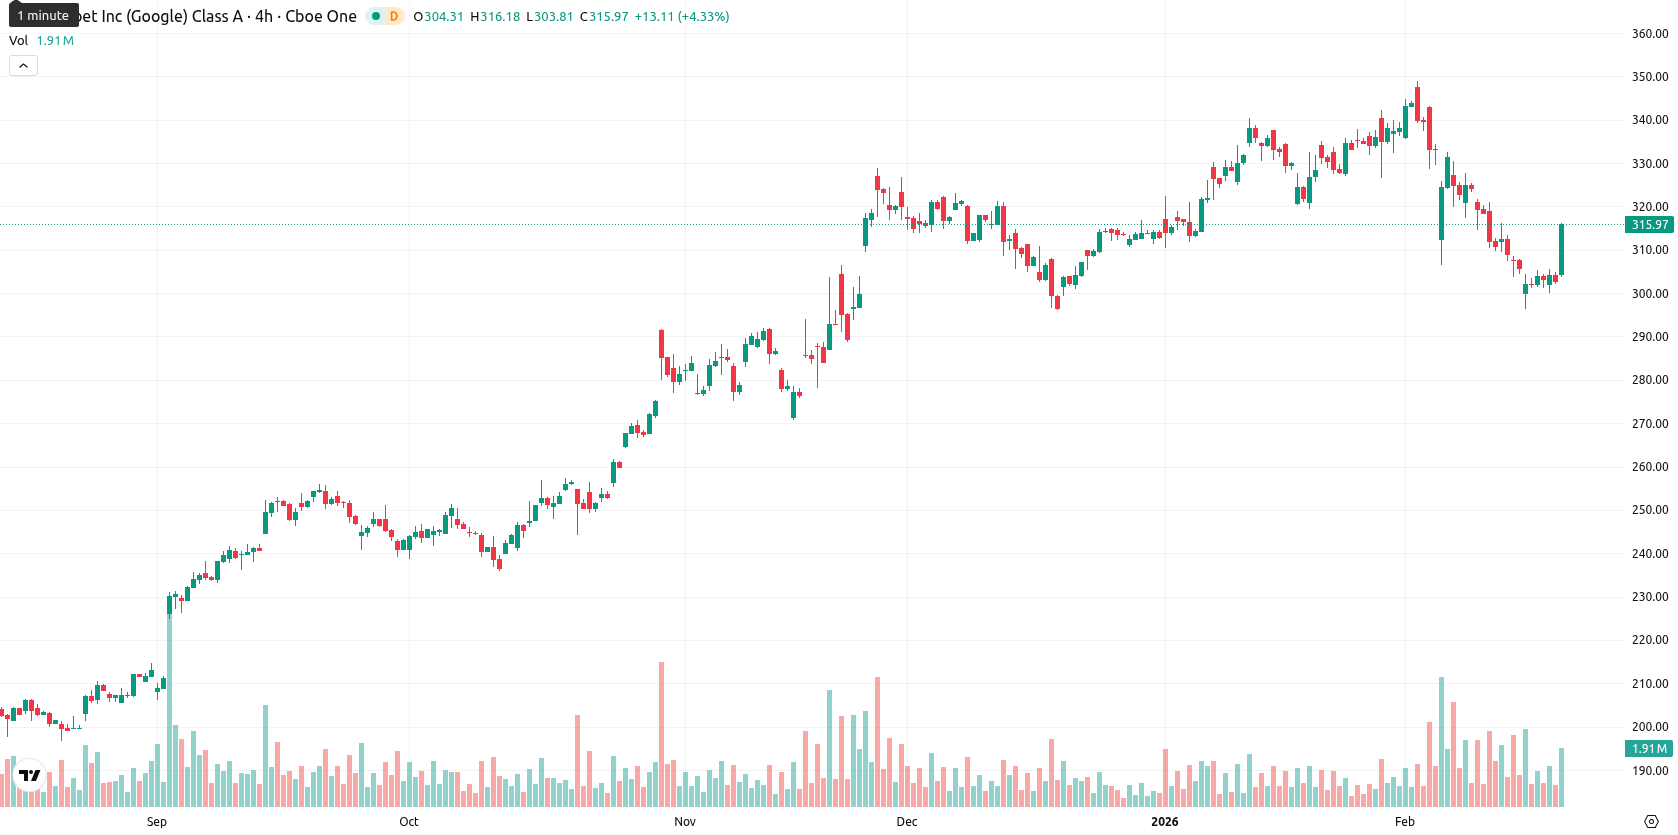
Alphabet Inc. (GOOGL) is trading at $315.91, below both the MA-20 ($324.31) and MA-50 ($320.22), but well above the MA-200 ($244.97). This positioning suggests short- and medium-term selling pressure while the long-term trend remains supportive, with the $322.63 Ichimoku Kijun marking immediate resistance.
Highlights
- Geopolitical instability escalated as the U.S. warned on February 18, 2026, about Iran crossing nuclear 'red lines,' raising risks of energy-driven inflation and market volatility impacting Alphabet.
- The U.S. Supreme Court struck down emergency tariffs imposed by executive authority, reducing direct regulatory threats and providing clarity for Alphabet amid ongoing macroeconomic uncertainty.
- GOOGL trades at $315.91, below MA-20 ($324.31) and MA-50 ($320.22), with a $309.25–$322.00 expected range and potential breakout above $322.63 resistance.
Middle East tensions and policy shifts drive tech market risk
Geopolitical instability in the Middle East has escalated, with the U.S. Vice President issuing a warning on February 18, 2026, about Iran crossing critical nuclear 'red lines.' The subsequent U.S. military buildup in the region, including deployment of carrier strike groups, has put global markets on alert for potential conflict that could disrupt oil passage through the Strait of Hormuz. This situation increases the risk of energy-driven inflation, which may limit central banks’ ability to ease monetary policy and thereby impact liquidity and risk appetite for technology stocks such as Alphabet. Presently, the U.S. Supreme Court has struck down recent emergency tariffs imposed under executive authority, reducing direct regulatory threat to Alphabet from broad-based trade barriers and providing increased clarity on U.S. trade policy. However, sustained geopolitical tension continues to elevate macroeconomic uncertainty, affecting market conditions relevant to Alphabet’s operational costs, consumer demand, and cross-border business functions.
Rally strength faces divergence with weak momentum signals
Momentum signals are mixed on the daily chart: the MACD and ADX both indicate weakening momentum, and several oscillators, including RSI (31.20), Stochastic RSI, and CCI, signal oversold conditions. Bull/Bear Power shows persistent seller dominance intraday, while the Awesome Oscillator direction does not reinforce a bullish recovery. After a modest opening gap, the price has rallied $13.13 higher (up 4.34%) and now trades near the upper end of today’s range ($304.98 – $315.38). Volatility is elevated with strength pushing towards intraday highs, but the divergence between strong daily gains and weak momentum readings hints at short-term fragility.
High upside probability within defined volatility corridor
For the next five trading days, the expected range is $309.25 to $322.00, capturing typical blue-chip volatility and aligning with immediate technical levels. The probability of a further price increase is very high (more than 80%), while the chance of a decline is much lower. The baseline scenario envisions a sideways consolidation within this corridor. A bullish breakout could occur if the price sustains above the immediate $322.63 resistance, targeting incremental highs. In a bearish scenario, a drop below $309.25 would expose GOOGL to renewed selling and test the next support levels closer to MA-50.
Previously it was reported that Alphabet Inc. is trading below its short- and medium-term moving averages, indicating ongoing seller pressure, while remaining firmly above its long-term support. Technical signals such as a deeply oversold RSI and strong upward intraday momentum point to a potential short-term rebound, though the kijun line and MA-20/50 act as key resistance levels.


Latest Google News


-
 Afghanistan
-
 Albania
-
 Algeria
-
 Angola
-
 Argentina
-
 Armenia
-
 Australia
-
 Austria
-
 Azerbaijan
-
 Bahamas
-
 Bahrain
-
 Bangladesh
-
 Belarus
-
 Belgium
-
 Bolivia
-
 Botswana
-
 Brazil
-
 Brunei
-
 Bulgaria
-
 Cambodia
-
 Cameroon
-
 Canada
-
 Chile
Chile
-
 China
China
-
 Colombia
-
 Congo
Congo
-
 Costa Rica
-
 Cote d'Ivoire
-
 Croatia
-
 Cuba
Cuba
-
 Cyprus
-
 Czechia
-
 DR Congo
-
 Denmark
-
 Dominican Republic
-
 Ecuador
-
 Egypt
Egypt
-
 El Salvador
-
 Estonia
-
 Eswatini
-
 Ethiopia
-
 Finland
-
 France
-
 Georgia
-
 Germany
-
 Ghana
Ghana
-
 Greece
-
 Haiti
Haiti
-
 Hong Kong
-
 Hungary
-
 India
India
-
 Indonesia
-
 Iran, Islamic republic
-
 Iraq
Iraq
-
 Ireland
-
 Israel
-
 Italy
Italy
-
 Jamaica
-
 Japan
Japan
-
 Jordan
-
 Kazakhstan
-
 Kenya
Kenya
-
 Korea
Korea
-
 Kuwait
-
 Kyrgyzstan
-
 Laos
Laos
-
 Latvia
-
 Lebanon
-
 Lesotho
-
 Libya
Libya
-
 Lithuania
-
 Luxembourg
-
 Madagascar
-
 Malaysia
-
 Malta
Malta
-
 Mauritius
-
 Mexico
-
 Moldova
-
 Mongolia
-
 Montenegro
-
 Morocco
-
 Mozambique
-
 Myanmar
-
 Namibia
-
 Nepal
Nepal
-
 Netherlands
-
 New Zealand
-
 Nigeria
-
 North Macedonia
-
 Norway
-
 Oman
Oman
-
 Pakistan
-
 Palestine
-
 Panama
-
 Papua New Guinea
-
 Paraguay
-
 Peru
Peru
-
 Philippines
-
 Poland
-
 Portugal
-
 Puerto Rico
-
 Qatar
Qatar
-
 Reunion
-
 Romania
-
 Rwanda
-
 Saudi Arabia
-
 Serbia
-
 Singapore
-
 Slovakia
-
 Slovenia
-
 Somalia
-
 South Africa
-
 Spain
Spain
-
 Sri Lanka
-
 Sweden
-
 Switzerland
-
 Syria
Syria
-
 Taiwan
-
 Tajikistan
-
 Tanzania
-
 Thailand
-
 Trinidad and Tobago
-
 Tunisia
-
 Turkey
-
 UAE
UAE
-
 Uganda
-
 Ukraine
-
 United Kingdom
-
United States
-
 Uruguay
-
 Uzbekistan
-
 Venezuela
-
 Vietnam
-
 Yemen
Yemen
-
 Zambia
-
 Zimbabwe
- Forex
- Crypto
