
Sundial Growers stock price forecast: Technical signals mixed as SNDL rises 3.69%

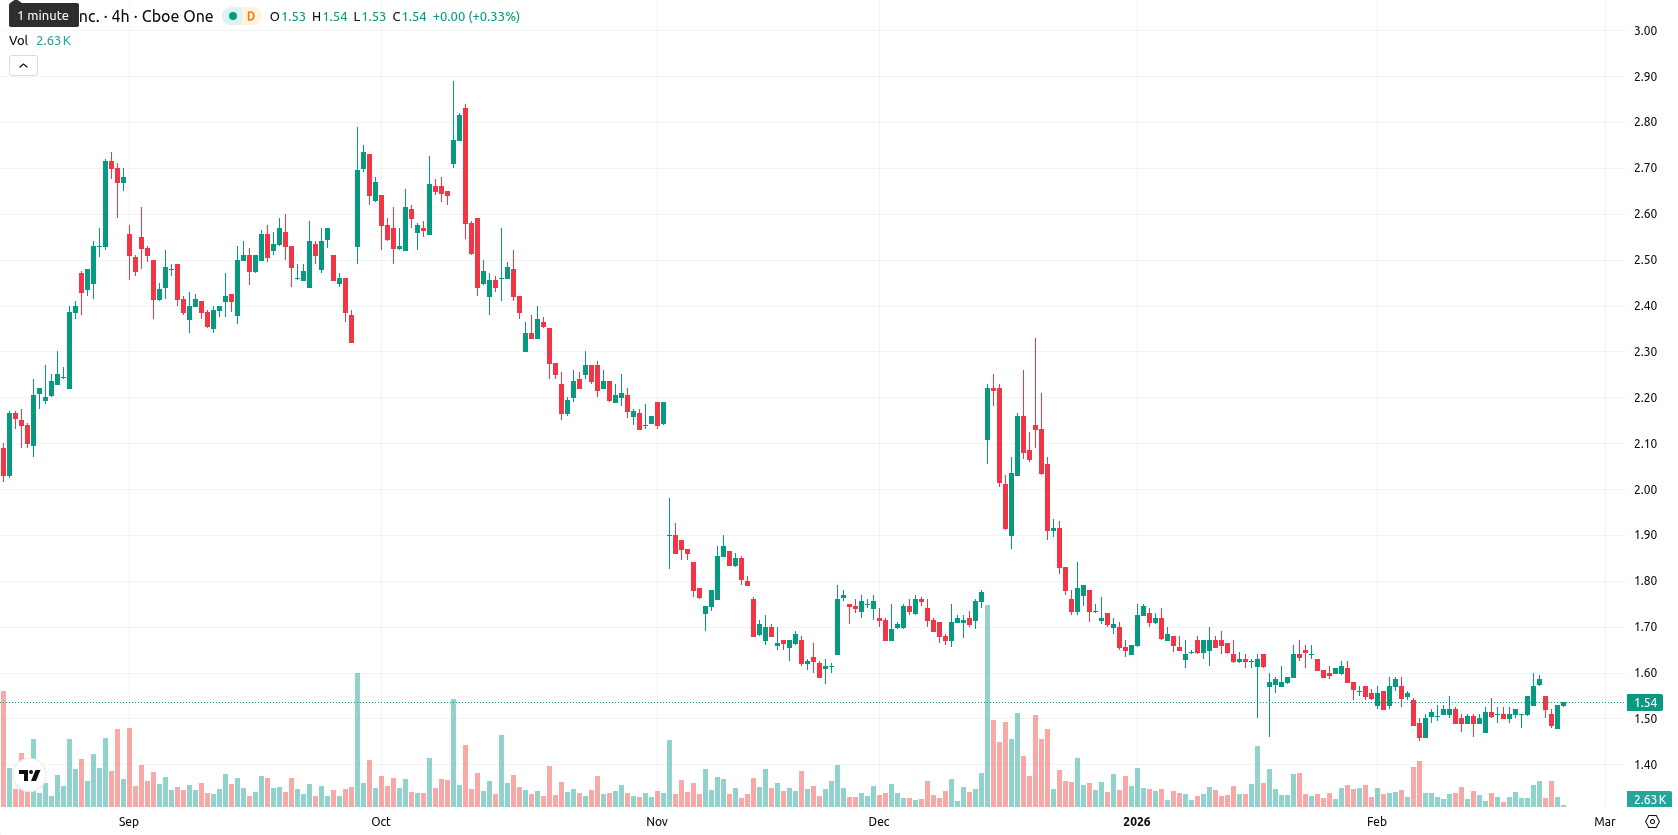
Sundial Growers Inc. (SNDL) is trading at $1.55, posting a 3.69% gain on the day. The price is above the MA-20 at $1.53 but remains below the MA-50 at $1.67 and the MA-200 at $1.80, reflecting short-term buoyancy within a medium- and long-term bearish structure.
Highlights
- SNDL trades at $1.55, above the MA-20 ($1.53) but below the MA-50 ($1.67) and MA-200 ($1.80), signaling short-term strength in a broader bearish trend.
- Momentum indicators remain weak as the MACD issues a strong sell, ADX is low at 18.60, and RSI sits at a neutral-bearish 42.34 with no strong overbought or oversold signals.
- Expected range for the next five trading days is $1.49–$1.61, with less than a 20% probability of a price increase and likely sideways-to-downward consolidation.
Bearish momentum persists as resistance caps weak technical signals
The Ichimoku Kijun sits at $1.56, placing immediate resistance just overhead and indicating supply pressure. Momentum signals remain weak, as the MACD shows a strong sell signal and the ADX at 18.60 points to lackluster trend strength. The RSI at 42.34 and Stochastic RSI at 46.60 are both neutral to slightly bearish, while the Commodity Channel Index is also neutral, suggesting no strong overbought or oversold conditions. Bull/Bear Power currently tilts in favor of buyers and the Awesome Oscillator remains neutral, highlighting a divergence between short-term intraday strength and prevailing bearish momentum.
Downside risk prevails as price struggles to surpass resistance
Over the next five trading days, SNDL is expected to consolidate sideways within a typical volatility band of $1.49 to $1.61. The probability of short-term price increase is low, with further declines appearing more likely. An upward scenario would require a breakout above the $1.56 – $1.61 resistance zone to attract new buyers, while loss of support at $1.49 would expose the price to further downside risk.
Previously it was reported that SNDL is consolidating near its 20-day moving average while remaining below both the 50- and 200-day averages, signaling persistent selling pressure across multiple timeframes with dynamic resistance aligning near $1.56 and support around $1.50. Despite minor intraday buying and a slight gain today, weak momentum signals from MACD, muted trend strength per ADX, and bearish readings on Stoch RSI and CCI indicate continued technical uncertainty.


-
 Afghanistan
-
 Albania
-
 Algeria
-
 Angola
-
 Argentina
-
 Armenia
-
 Australia
-
 Austria
-
 Azerbaijan
-
 Bahamas
-
 Bahrain
-
 Bangladesh
-
 Belarus
-
 Belgium
-
 Bolivia
-
 Botswana
-
 Brazil
-
 Brunei
-
 Bulgaria
-
 Cambodia
-
 Cameroon
-
 Canada
-
 Chile
Chile
-
 China
China
-
 Colombia
-
 Congo
Congo
-
 Costa Rica
-
 Cote d'Ivoire
-
 Croatia
-
 Cuba
Cuba
-
 Cyprus
-
 Czechia
-
 DR Congo
-
 Denmark
-
 Dominican Republic
-
 Ecuador
-
 Egypt
Egypt
-
 El Salvador
-
 Estonia
-
 Eswatini
-
 Ethiopia
-
 Finland
-
 France
-
 Georgia
-
 Germany
-
 Ghana
Ghana
-
 Greece
-
 Haiti
Haiti
-
 Hong Kong
-
 Hungary
-
 India
India
-
 Indonesia
-
 Iran, Islamic republic
-
 Iraq
Iraq
-
 Ireland
-
 Israel
-
 Italy
Italy
-
 Jamaica
-
 Japan
Japan
-
 Jordan
-
 Kazakhstan
-
 Kenya
Kenya
-
 Korea
Korea
-
 Kuwait
-
 Kyrgyzstan
-
 Laos
Laos
-
 Latvia
-
 Lebanon
-
 Lesotho
-
 Libya
Libya
-
 Lithuania
-
 Luxembourg
-
 Madagascar
-
 Malaysia
-
 Malta
Malta
-
 Mauritius
-
 Mexico
-
 Moldova
-
 Mongolia
-
 Montenegro
-
 Morocco
-
 Mozambique
-
 Myanmar
-
 Namibia
-
 Nepal
Nepal
-
 Netherlands
-
 New Zealand
-
 Nigeria
-
 North Macedonia
-
 Norway
-
 Oman
Oman
-
 Pakistan
-
 Palestine
-
 Panama
-
 Papua New Guinea
-
 Paraguay
-
 Peru
Peru
-
 Philippines
-
 Poland
-
 Portugal
-
 Puerto Rico
-
 Qatar
Qatar
-
 Reunion
-
 Romania
-
 Rwanda
-
 Saudi Arabia
-
 Serbia
-
 Singapore
-
 Slovakia
-
 Slovenia
-
 Somalia
-
 South Africa
-
 Spain
Spain
-
 Sri Lanka
-
 Sweden
-
 Switzerland
-
 Syria
Syria
-
 Taiwan
-
 Tajikistan
-
 Tanzania
-
 Thailand
-
 Trinidad and Tobago
-
 Tunisia
-
 Turkey
-
 UAE
UAE
-
 Uganda
-
 Ukraine
-
 United Kingdom
-
United States
-
 Uruguay
-
 Uzbekistan
-
 Venezuela
-
 Vietnam
-
 Yemen
Yemen
-
 Zambia
-
 Zimbabwe
- Forex
- Crypto
