
Intuit holds steady near $381 as bearish momentum persists below all major moving averages – weekly outlook

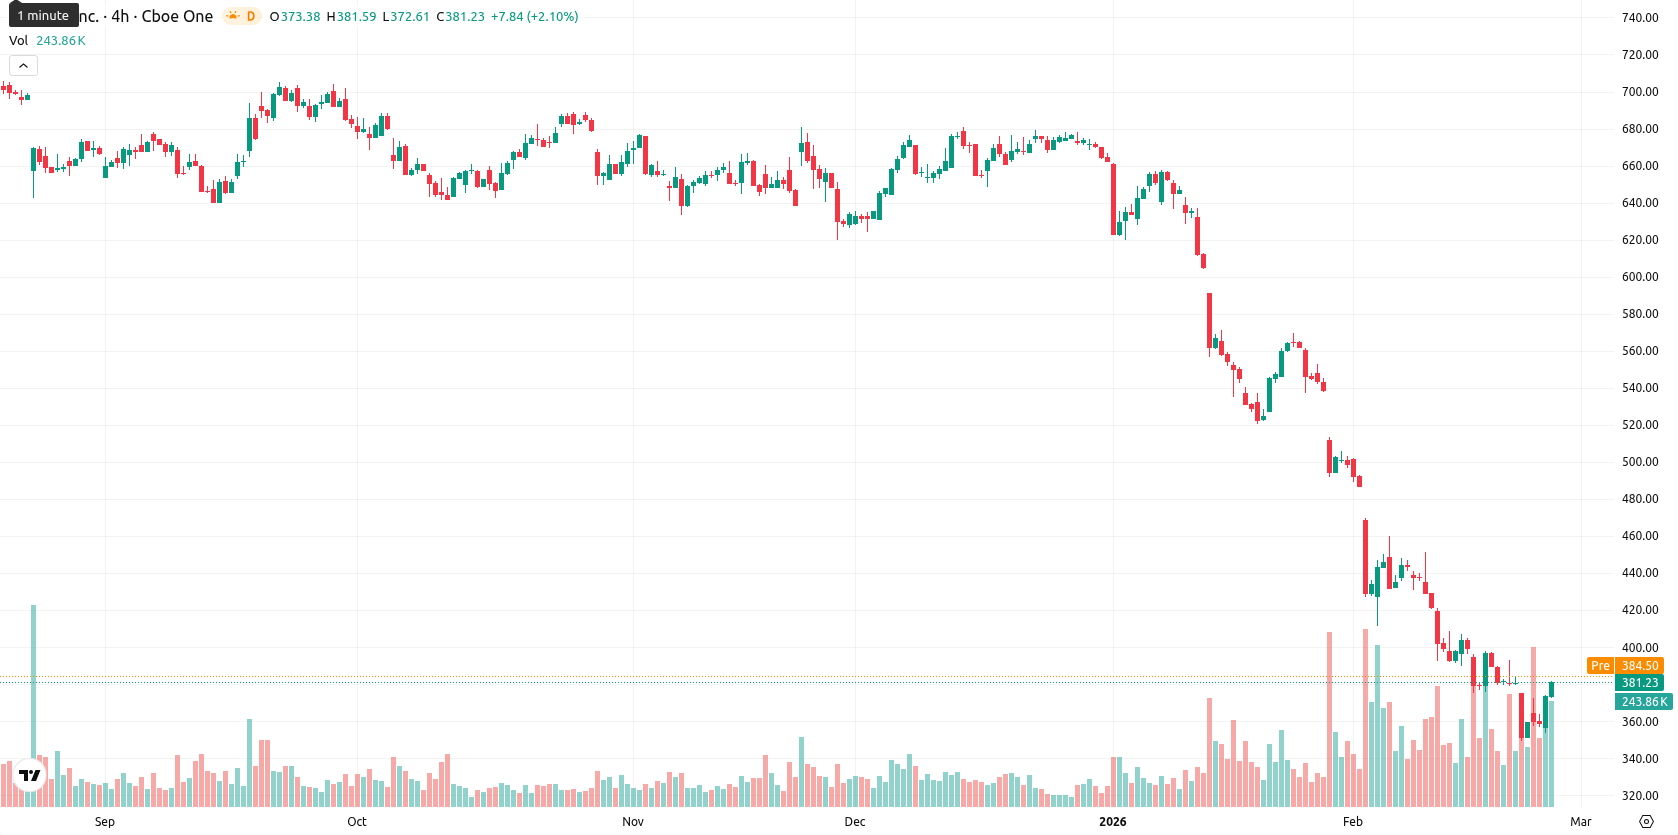
Intuit Inc. (INTU) trades at $381.44 after a sharp weekly recovery, up $22.73 or 6.34% over the last week. Despite this bounce, the asset remains well below its weekly MA-20 at $423.60, MA-50 at $544.32, and MA-200 at $663.06 — a clear sign of ongoing downside momentum and positioning INTU at a considerable discount to its short, medium, and long-term trend averages.
Highlights
- INTU trades at $381.44, significantly below its MA-20 ($423.60), MA-50 ($544.32), and MA-200 ($663.06), signaling sustained downside pressure across all timeframes.
- Daily momentum indicators—MACD, ADX, and Bull/Bear Power—are distinctly bearish, while oversold RSI and CCI clash with an overbought Stochastic RSI, indicating divergence and heightened volatility.
- Expected five-day trading range is $352.00 to $386.00, with downside bias and resistance at $386.00; a break below $352.00 points to further declines.
Earnings anticipation and AI partnerships shape weekly sentiment
Intuit is set to release its quarterly earnings report after market close on Thursday, following a prior revenue beat of $3.89 billion, marking an 18.3% year-on-year increase. The company recently announced a multi-year partnership with Anthropic to embed Claude-powered AI agents into its financial and business management platforms, expanding capabilities across TurboTax, Credit Karma, QuickBooks, and Mailchimp. In addition, Intuit has extended its collaboration with Wix.com to drive integrated AI-driven finance and website solutions for small businesses.
Bearish momentum persists as weekly indicators remain oversold
On the weekly timeframe, INTU is well entrenched below all major moving averages — the MA-20 at $423.60, MA-50 at $544.32, and MA-200 at $663.06 — underscoring persistent bearish momentum. Weekly dynamic resistance is marked by the Ichimoku Kijun level at $459.19, with the nearest significant support situated at recent lows. Weekly RSI and CCI indicators register as oversold, while weekly oscillators confirm ongoing selling pressure, indicating trend continuation risk despite the recent intraday rebound.
Sideways bias favored next week amid capped upside and bearish signals
For the coming week, INTU is expected to trade within a $352.00 to $386.00 range, with a low probability of a sustained price increase. Sideways consolidation is the baseline scenario, as persistent bearish signals and resistance levels cap upside potential. A bullish break above $386.00 could lead to a test of the $459.19 resistance, while a drop below $352.00 would expose the stock to further declines. Sellers are likely to retain control unless a decisive catalyst emerges.
Previously it was reported that Intuit Inc. continues to trade under sustained technical pressure, remaining well below its key moving averages with bearish momentum signals including negative MACD and low RSI confirming a deeply oversold environment. Despite a short-term intraday rebound driven by AI partnership news and earnings anticipation, the stock lacks moving average support and faces dynamic resistance, highlighting the divergence between temporary bullish sentiment and the broader downtrend.


-
 Afghanistan
-
 Albania
-
 Algeria
-
 Angola
-
 Argentina
-
 Armenia
-
 Australia
-
 Austria
-
 Azerbaijan
-
 Bahamas
-
 Bahrain
-
 Bangladesh
-
 Belarus
-
 Belgium
-
 Bolivia
-
 Botswana
-
 Brazil
-
 Brunei
-
 Bulgaria
-
 Cambodia
-
 Cameroon
-
 Canada
-
 Chile
Chile
-
 China
China
-
 Colombia
-
 Congo
Congo
-
 Costa Rica
-
 Cote d'Ivoire
-
 Croatia
-
 Cuba
Cuba
-
 Cyprus
-
 Czechia
-
 DR Congo
-
 Denmark
-
 Dominican Republic
-
 Ecuador
-
 Egypt
Egypt
-
 El Salvador
-
 Estonia
-
 Eswatini
-
 Ethiopia
-
 Finland
-
 France
-
 Georgia
-
 Germany
-
 Ghana
Ghana
-
 Greece
-
 Haiti
Haiti
-
 Hong Kong
-
 Hungary
-
 India
India
-
 Indonesia
-
 Iran, Islamic republic
-
 Iraq
Iraq
-
 Ireland
-
 Israel
-
 Italy
Italy
-
 Jamaica
-
 Japan
Japan
-
 Jordan
-
 Kazakhstan
-
 Kenya
Kenya
-
 Korea
Korea
-
 Kuwait
-
 Kyrgyzstan
-
 Laos
Laos
-
 Latvia
-
 Lebanon
-
 Lesotho
-
 Libya
Libya
-
 Lithuania
-
 Luxembourg
-
 Madagascar
-
 Malaysia
-
 Malta
Malta
-
 Mauritius
-
 Mexico
-
 Moldova
-
 Mongolia
-
 Montenegro
-
 Morocco
-
 Mozambique
-
 Myanmar
-
 Namibia
-
 Nepal
Nepal
-
 Netherlands
-
 New Zealand
-
 Nigeria
-
 North Macedonia
-
 Norway
-
 Oman
Oman
-
 Pakistan
-
 Palestine
-
 Panama
-
 Papua New Guinea
-
 Paraguay
-
 Peru
Peru
-
 Philippines
-
 Poland
-
 Portugal
-
 Puerto Rico
-
 Qatar
Qatar
-
 Reunion
-
 Romania
-
 Rwanda
-
 Saudi Arabia
-
 Serbia
-
 Singapore
-
 Slovakia
-
 Slovenia
-
 Somalia
-
 South Africa
-
 Spain
Spain
-
 Sri Lanka
-
 Sweden
-
 Switzerland
-
 Syria
Syria
-
 Taiwan
-
 Tajikistan
-
 Tanzania
-
 Thailand
-
 Trinidad and Tobago
-
 Tunisia
-
 Turkey
-
 UAE
UAE
-
 Uganda
-
 Ukraine
-
 United Kingdom
-
United States
-
 Uruguay
-
 Uzbekistan
-
 Venezuela
-
 Vietnam
-
 Yemen
Yemen
-
 Zambia
-
 Zimbabwe
- Forex
- Crypto
