
Hut 8 stock rises 3.62% as bullish technicals outweigh $279 million quarterly setback

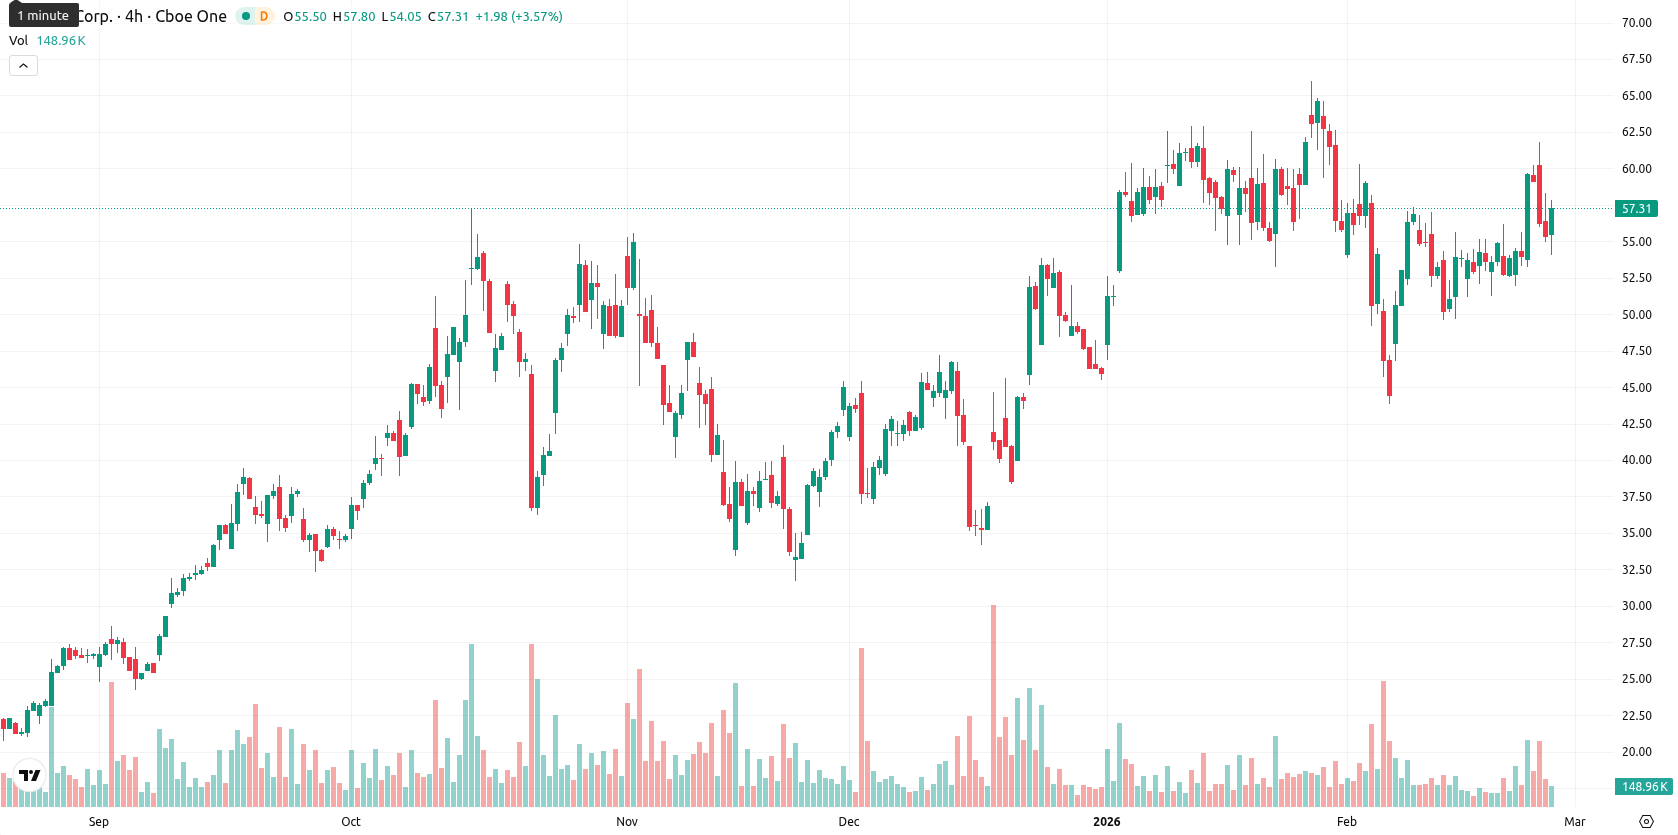
Hut 8 Corp (HUT) is trading at $57.30, up 3.62% on the day, and remains above the MA-20 ($55.12), MA-50 ($53.51), and MA-200 ($35.66), confirming bullish momentum across all major timeframes. The Ichimoku Kijun at $54.94 acts as near-term support just below the current level.
Highlights
- Hut 8 reported a Q4 2026 net loss of $279.7 million, reversing from net income a year prior, mainly due to digital asset revaluations and Bitcoin volatility.
- Revenue rose 45% to $235.1 million, fueled by Compute segment growth and gross margin expansion, while the company shifted strategy toward capital-efficient AI infrastructure and the River Bend development.
- Hut 8 trades at $57.30 above MA-20/MA-50/MA-200, with immediate support at $54.94 and a high probability (>80%) of consolidation between $54.50–$59.10 in the next five days.
Net loss reverses prior profit as asset revaluation and volatility weigh on earnings
On February 25, 2026, Hut 8 reported a net loss of $279.7 million for the fourth quarter, reversing from net income a year prior, mainly due to accounting revaluations of digital assets and ongoing Bitcoin price volatility. However, revenue grew 45% to $235.1 million, driven by strong expansion in the Compute segment and improved gross margins. The company also announced a strategic shift toward capital efficiency, focusing on infrastructure and AI data center projects, including the River Bend development and a partnership with Anthropic.
Mixed momentum and overbought signals as volatility heightens near resistance
Momentum signals on the daily chart are mixed for HUT. The MACD and ADX are neutral, indicating a lack of strong directional movement, while the RSI and CCI suggest mild buying pressure, but the Stochastic RSI signals a strong sell (potential overbought). Bull/Bear Power is firmly overbought, showing intraday buyer strength, and the Awesome Oscillator remains neutral. Immediate support lies at the Ichimoku Kijun ($54.94), with moderate to high volatility as buyers push prices toward session highs. Key support is at $54.50 and resistance at $59.10.
Price appreciation favored amid tight range and strong technical buy signals
Over the next five trading days, HUT is expected to remain within a volatility band of $54.50 to $59.10, representing typical price fluctuations within 10% of the current level. There is a very high probability (over 80%) of price appreciation, with downside risk considered limited, given the cluster of weekly buy signals on the RSI, ADX, MACD, and MA-50 indicators. Baseline expectations are for price consolidation between $54.50 and $59.10. A decisive break above $59.10 could trigger further gains, while failure of support at $54.50 may see a retracement to lower weekly levels.
Previously it was reported that Hut 8 Corp. is exhibiting a strong bullish trend, with the stock trading well above key moving averages and buoyed by institutional accumulation despite recent earnings and revenue misses. However, while RSI and price action indicate sustained buyer dominance, mixed momentum signals and overbought oscillators highlight rising short-term volatility and caution against the likelihood of continued sharp gains.


-
 Afghanistan
-
 Albania
-
 Algeria
-
 Angola
-
 Argentina
-
 Armenia
-
 Australia
-
 Austria
-
 Azerbaijan
-
 Bahamas
-
 Bahrain
-
 Bangladesh
-
 Belarus
-
 Belgium
-
 Bolivia
-
 Botswana
-
 Brazil
-
 Brunei
-
 Bulgaria
-
 Cambodia
-
 Cameroon
-
 Canada
-
 Chile
Chile
-
 China
China
-
 Colombia
-
 Congo
Congo
-
 Costa Rica
-
 Cote d'Ivoire
-
 Croatia
-
 Cuba
Cuba
-
 Cyprus
-
 Czechia
-
 DR Congo
-
 Denmark
-
 Dominican Republic
-
 Ecuador
-
 Egypt
Egypt
-
 El Salvador
-
 Estonia
-
 Eswatini
-
 Ethiopia
-
 Finland
-
 France
-
 Georgia
-
 Germany
-
 Ghana
Ghana
-
 Greece
-
 Haiti
Haiti
-
 Hong Kong
-
 Hungary
-
 India
India
-
 Indonesia
-
 Iran, Islamic republic
-
 Iraq
Iraq
-
 Ireland
-
 Israel
-
 Italy
Italy
-
 Jamaica
-
 Japan
Japan
-
 Jordan
-
 Kazakhstan
-
 Kenya
Kenya
-
 Korea
Korea
-
 Kuwait
-
 Kyrgyzstan
-
 Laos
Laos
-
 Latvia
-
 Lebanon
-
 Lesotho
-
 Libya
Libya
-
 Lithuania
-
 Luxembourg
-
 Madagascar
-
 Malaysia
-
 Malta
Malta
-
 Mauritius
-
 Mexico
-
 Moldova
-
 Mongolia
-
 Montenegro
-
 Morocco
-
 Mozambique
-
 Myanmar
-
 Namibia
-
 Nepal
Nepal
-
 Netherlands
-
 New Zealand
-
 Nigeria
-
 North Macedonia
-
 Norway
-
 Oman
Oman
-
 Pakistan
-
 Palestine
-
 Panama
-
 Papua New Guinea
-
 Paraguay
-
 Peru
Peru
-
 Philippines
-
 Poland
-
 Portugal
-
 Puerto Rico
-
 Qatar
Qatar
-
 Reunion
-
 Romania
-
 Rwanda
-
 Saudi Arabia
-
 Serbia
-
 Singapore
-
 Slovakia
-
 Slovenia
-
 Somalia
-
 South Africa
-
 Spain
Spain
-
 Sri Lanka
-
 Sweden
-
 Switzerland
-
 Syria
Syria
-
 Taiwan
-
 Tajikistan
-
 Tanzania
-
 Thailand
-
 Trinidad and Tobago
-
 Tunisia
-
 Turkey
-
 UAE
UAE
-
 Uganda
-
 Ukraine
-
 United Kingdom
-
United States
-
 Uruguay
-
 Uzbekistan
-
 Venezuela
-
 Vietnam
-
 Yemen
Yemen
-
 Zambia
-
 Zimbabwe
- Forex
- Crypto
