
-4.42% for Quantum Computing stock — Downside momentum persists below key averages

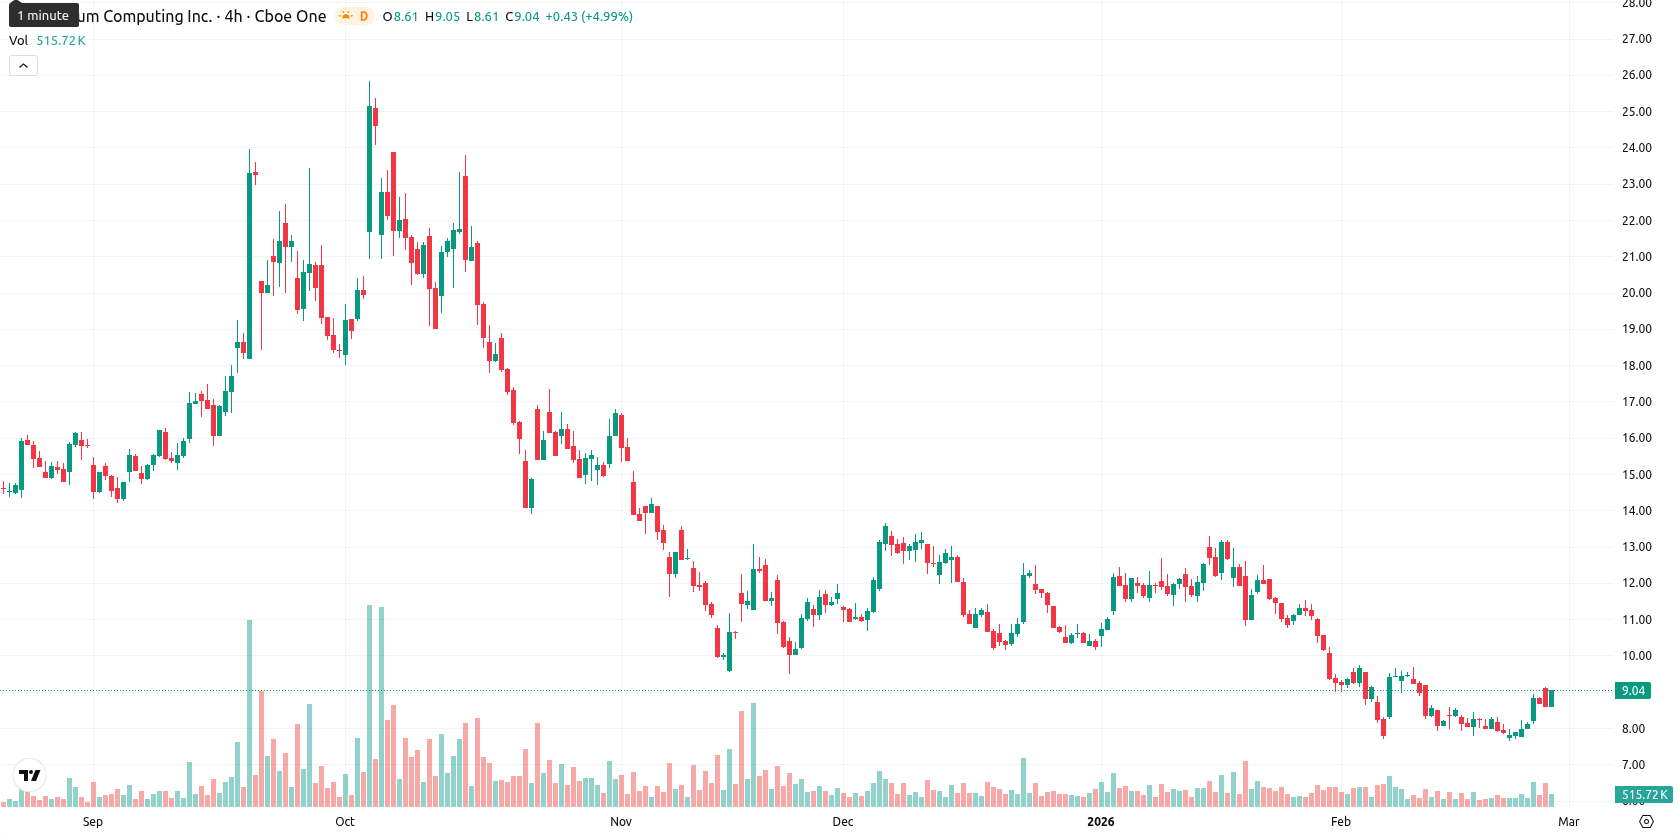
Quantum Computing Inc. (QUBT) is trading at $8.64, down 4.42% on the day. The shares are currently just below the MA-20 ($8.73), well under the MA-50 ($10.35), and notably beneath the MA-200 ($14.41), highlighting ongoing medium- and long-term selling pressure and a short-term consolidation pattern.
Highlights
- QUBT is trading at $8.64, below its MA-20 ($8.73), MA-50 ($10.35), and MA-200 ($14.41), indicating persistent medium- and long-term selling pressure.
- Momentum indicators are mixed: the daily MACD signals strong bearish momentum, RSI shows neutral-to-slightly bearish sentiment, and Stochastic RSI and CCI are in overbought territory.
- The price corridor for the next five trading days is projected at $7.80–$9.10, with less than a 20% chance of upside and continued downside risk dominating.
Mixed momentum as resistance and volatility shape technical signals
Technical indicators show mixed signals for QUBT. The MACD on the daily chart indicates strong negative momentum, while the ADX remains neutral, reflecting weak trend strength. The daily RSI is neutral to slightly bearish, with both Stochastic RSI and CCI signaling overbought conditions, and Bull/Bear Power suggests strong intraday buyer dominance. The Awesome Oscillator is neutral, with price now near the lower end of today’s range following high intraday volatility and persistent pressure after the open. Immediate resistance is found at the Ichimoku Kijun on D1 ($10.13); key support stands near this week’s lows.
Further downside likely as recovery contingent on resistance breakout
In the short term, QUBT is expected to trade within a typical volatility band between $7.80 and $9.10 over the next five sessions. The probability of upside moves is estimated to be less than 20%, making further downside more likely based on current signals. Most scenarios point to continued consolidation in a sideways channel while the price holds recent support and resistance levels. A break above $10.13 could open the door to a recovery phase, whereas extended selling below support would increase the risk of a move toward $7.80 or lower.
Previously it was reported that Quantum Computing Inc. is exhibiting short-term upward momentum, trading above its 20-day moving average but facing strong resistance at the 50-day and 200-day moving averages. Despite investor optimism driven by a major acquisition and policy tailwinds, technical indicators such as MACD, ADX, and RSI present a mixed-to-weak trend outlook, with overbought conditions and immediate resistance near $10.30 limiting breakout potential.


Latest Quantum Computing News


-
 Afghanistan
-
 Albania
-
 Algeria
-
 Angola
-
 Argentina
-
 Armenia
-
 Australia
-
 Austria
-
 Azerbaijan
-
 Bahamas
-
 Bahrain
-
 Bangladesh
-
 Belarus
-
 Belgium
-
 Bolivia
-
 Botswana
-
 Brazil
-
 Brunei
-
 Bulgaria
-
 Cambodia
-
 Cameroon
-
 Canada
-
 Chile
Chile
-
 China
China
-
 Colombia
-
 Congo
Congo
-
 Costa Rica
-
 Cote d'Ivoire
-
 Croatia
-
 Cuba
Cuba
-
 Cyprus
-
 Czechia
-
 DR Congo
-
 Denmark
-
 Dominican Republic
-
 Ecuador
-
 Egypt
Egypt
-
 El Salvador
-
 Estonia
-
 Eswatini
-
 Ethiopia
-
 Finland
-
 France
-
 Georgia
-
 Germany
-
 Ghana
Ghana
-
 Greece
-
 Haiti
Haiti
-
 Hong Kong
-
 Hungary
-
 India
India
-
 Indonesia
-
 Iran, Islamic republic
-
 Iraq
Iraq
-
 Ireland
-
 Israel
-
 Italy
Italy
-
 Jamaica
-
 Japan
Japan
-
 Jordan
-
 Kazakhstan
-
 Kenya
Kenya
-
 Korea
Korea
-
 Kuwait
-
 Kyrgyzstan
-
 Laos
Laos
-
 Latvia
-
 Lebanon
-
 Lesotho
-
 Libya
Libya
-
 Lithuania
-
 Luxembourg
-
 Madagascar
-
 Malaysia
-
 Malta
Malta
-
 Mauritius
-
 Mexico
-
 Moldova
-
 Mongolia
-
 Montenegro
-
 Morocco
-
 Mozambique
-
 Myanmar
-
 Namibia
-
 Nepal
Nepal
-
 Netherlands
-
 New Zealand
-
 Nigeria
-
 North Macedonia
-
 Norway
-
 Oman
Oman
-
 Pakistan
-
 Palestine
-
 Panama
-
 Papua New Guinea
-
 Paraguay
-
 Peru
Peru
-
 Philippines
-
 Poland
-
 Portugal
-
 Puerto Rico
-
 Qatar
Qatar
-
 Reunion
-
 Romania
-
 Rwanda
-
 Saudi Arabia
-
 Serbia
-
 Singapore
-
 Slovakia
-
 Slovenia
-
 Somalia
-
 South Africa
-
 Spain
Spain
-
 Sri Lanka
-
 Sweden
-
 Switzerland
-
 Syria
Syria
-
 Taiwan
-
 Tajikistan
-
 Tanzania
-
 Thailand
-
 Trinidad and Tobago
-
 Tunisia
-
 Turkey
-
 UAE
UAE
-
 Uganda
-
 Ukraine
-
 United Kingdom
-
United States
-
 Uruguay
-
 Uzbekistan
-
 Venezuela
-
 Vietnam
-
 Yemen
Yemen
-
 Zambia
-
 Zimbabwe
- Forex
- Crypto
