
Broader market selling and technical pressure — Robinhood stock drops 3.68%

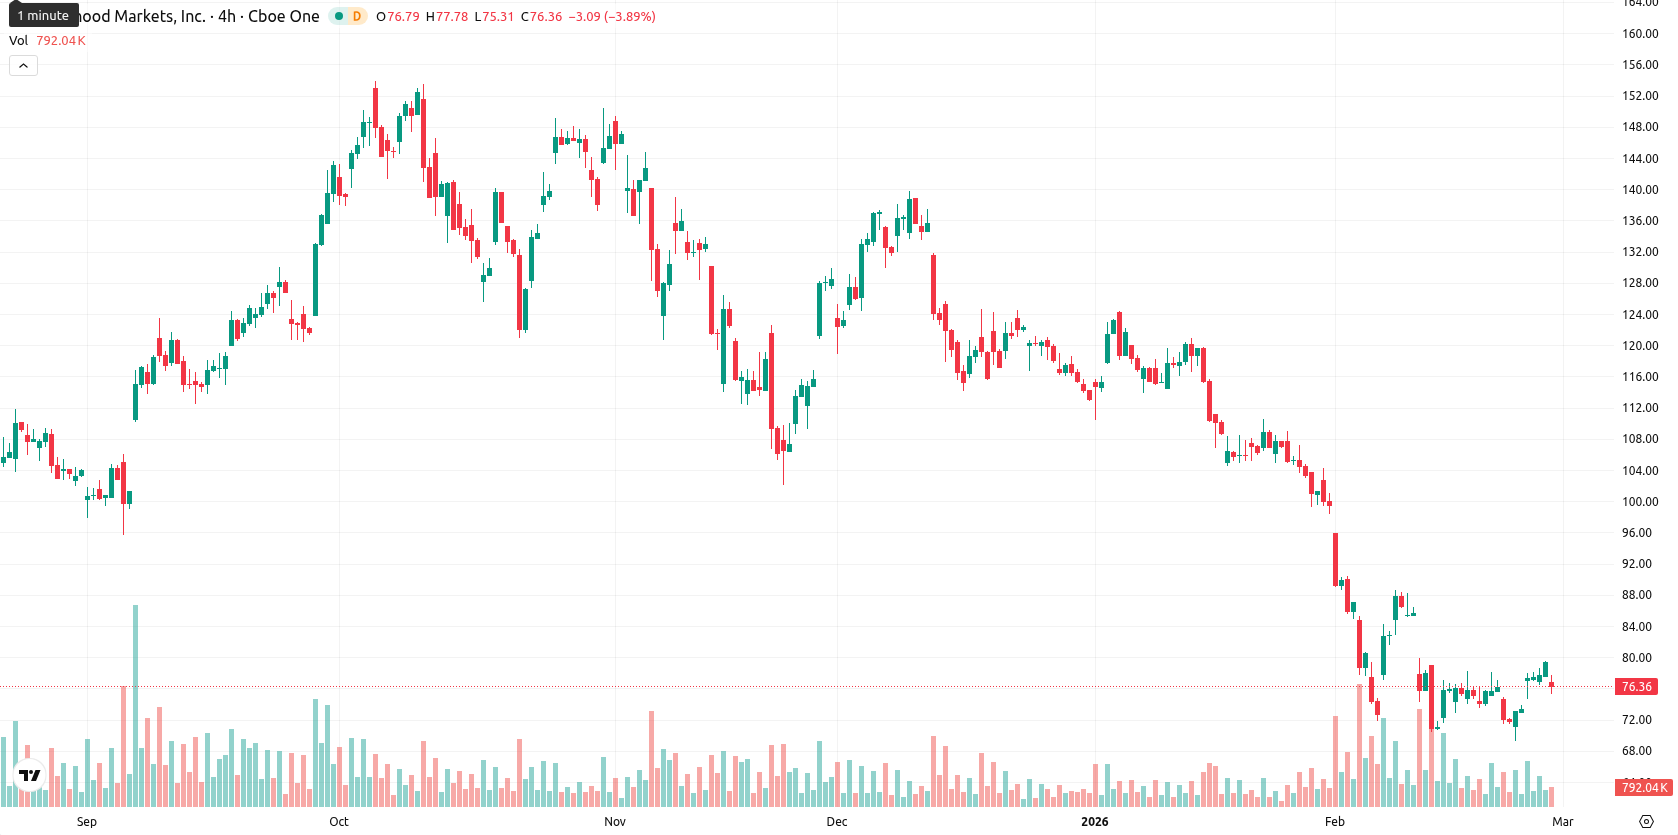
Robinhood Markets Inc (HOOD) is trading at $76.53 after a daily decline of 3.68%. The asset remains below its MA-20 ($80.78), MA-50 ($101.13), and MA-200 ($106.83), indicating sustained selling pressure across short-, medium-, and long-term timeframes.
Highlights
- Robinhood expanded into wealth management by acquiring TradePMR in February 2025 and rolled out a new AI-enabled tax filing service with April, free through April 15, 2026.
- International expansion into the UK and EU, along with 24/5 trading on 1,700+ stocks and ETFs, underscores Robinhood’s drive for diversified growth despite Q4 2025 crypto revenue declines.
- ROBINHOOD shares trade at $76.53, below MA-20 ($80.78), with strong bearish momentum and 80% probability of further decline toward $73.50 support zone.
Expansion initiatives and product launches amid persistent selling pressure
In February 2025, Robinhood acquired TradePMR, marking an expansion into wealth management and traditional financial services. The company has also launched a new tax filing service in partnership with the AI-powered platform April, allowing eligible users to file federal and state taxes free until April 15, 2026. Additional recent actions include the introduction of 24/5 trading for over 1,700 stocks and ETFs and international expansion into the UK and EU. Net interest income continued to grow even as Q4 2025 crypto-related revenues moved lower, though price action has remained under broader selling pressure.
Divergent momentum and oscillator signals as price tests session lows
The current price of Robinhood ($76.53) is trading below the MA-20 ($80.78), MA-50 ($101.13), and MA-200 ($106.83) levels, indicating sustained short-, medium-, and long-term pressure from sellers. The Ichimoku Kijun at $89.82 stands above the latest price, serving as an immediate resistance level. Momentum signals are bearish, with the MACD on both daily and weekly timeframes pointing to strong downward momentum, while the ADX confirms a clear trend. The RSI readings remain in sell territory, and the Stochastic RSI is overbought, suggesting a possible exhaustion after a surge, while the CCI is neutral. Bull/Bear Power registers as overbought, indicating recent buyer dominance, but this is countered by negative daily price action. The Awesome Oscillator does not explicitly confirm the prevailing trend. Today’s session opened with a noticeable gap down from the previous close, and the price currently trades near the session low of its daily range ($75.35 – $77.61) after declining 3.68%, with moderate intraday volatility and clear pressure after the open. Oscillator and momentum signals diverge, hinting at a short-term pause or instability despite recent selling pressure.
Sideways outlook with high downside risk as sellers remain dominant
For the next 5 trading days, the expected normalized range is $73.50 – $78.10. The probability of further price decline is very high (more than 80%), with a price rebound looking much less likely. The baseline scenario sees the price moving within a sideways range as volatility persists. A bullish scenario would require a break above immediate resistance near $89.82, which current conditions do not favor, while a bearish scenario could unfold if the price slips below the $73.50 support zone, with sellers maintaining control in the absence of a momentum reversal.
Previously it was reported that Robinhood Markets Inc. remains under significant selling pressure, with the current price trading below all major moving averages, and technical indicators such as MACD, ADX, and RSI signaling sustained bearish momentum. Immediate support is in the $75.65 area, while multi-level resistance, including the Ichimoku Kijun and MA-20, continues to cap near-term upside despite recent new service launches.


Latest Robinhood News


-
 Afghanistan
-
 Albania
-
 Algeria
-
 Angola
-
 Argentina
-
 Armenia
-
 Australia
-
 Austria
-
 Azerbaijan
-
 Bahamas
-
 Bahrain
-
 Bangladesh
-
 Belarus
-
 Belgium
-
 Bolivia
-
 Botswana
-
 Brazil
-
 Brunei
-
 Bulgaria
-
 Cambodia
-
 Cameroon
-
 Canada
-
 Chile
Chile
-
 China
China
-
 Colombia
-
 Congo
Congo
-
 Costa Rica
-
 Cote d'Ivoire
-
 Croatia
-
 Cuba
Cuba
-
 Cyprus
-
 Czechia
-
 DR Congo
-
 Denmark
-
 Dominican Republic
-
 Ecuador
-
 Egypt
Egypt
-
 El Salvador
-
 Estonia
-
 Eswatini
-
 Ethiopia
-
 Finland
-
 France
-
 Georgia
-
 Germany
-
 Ghana
Ghana
-
 Greece
-
 Haiti
Haiti
-
 Hong Kong
-
 Hungary
-
 India
India
-
 Indonesia
-
 Iran, Islamic republic
-
 Iraq
Iraq
-
 Ireland
-
 Israel
-
 Italy
Italy
-
 Jamaica
-
 Japan
Japan
-
 Jordan
-
 Kazakhstan
-
 Kenya
Kenya
-
 Korea
Korea
-
 Kuwait
-
 Kyrgyzstan
-
 Laos
Laos
-
 Latvia
-
 Lebanon
-
 Lesotho
-
 Libya
Libya
-
 Lithuania
-
 Luxembourg
-
 Madagascar
-
 Malaysia
-
 Malta
Malta
-
 Mauritius
-
 Mexico
-
 Moldova
-
 Mongolia
-
 Montenegro
-
 Morocco
-
 Mozambique
-
 Myanmar
-
 Namibia
-
 Nepal
Nepal
-
 Netherlands
-
 New Zealand
-
 Nigeria
-
 North Macedonia
-
 Norway
-
 Oman
Oman
-
 Pakistan
-
 Palestine
-
 Panama
-
 Papua New Guinea
-
 Paraguay
-
 Peru
Peru
-
 Philippines
-
 Poland
-
 Portugal
-
 Puerto Rico
-
 Qatar
Qatar
-
 Reunion
-
 Romania
-
 Rwanda
-
 Saudi Arabia
-
 Serbia
-
 Singapore
-
 Slovakia
-
 Slovenia
-
 Somalia
-
 South Africa
-
 Spain
Spain
-
 Sri Lanka
-
 Sweden
-
 Switzerland
-
 Syria
Syria
-
 Taiwan
-
 Tajikistan
-
 Tanzania
-
 Thailand
-
 Trinidad and Tobago
-
 Tunisia
-
 Turkey
-
 UAE
UAE
-
 Uganda
-
 Ukraine
-
 United Kingdom
-
United States
-
 Uruguay
-
 Uzbekistan
-
 Venezuela
-
 Vietnam
-
 Yemen
Yemen
-
 Zambia
-
 Zimbabwe
- Forex
- Crypto
