
Intuit stock price forecast: Bullish earnings outlook as INTU climbs 3.74% to $409.18

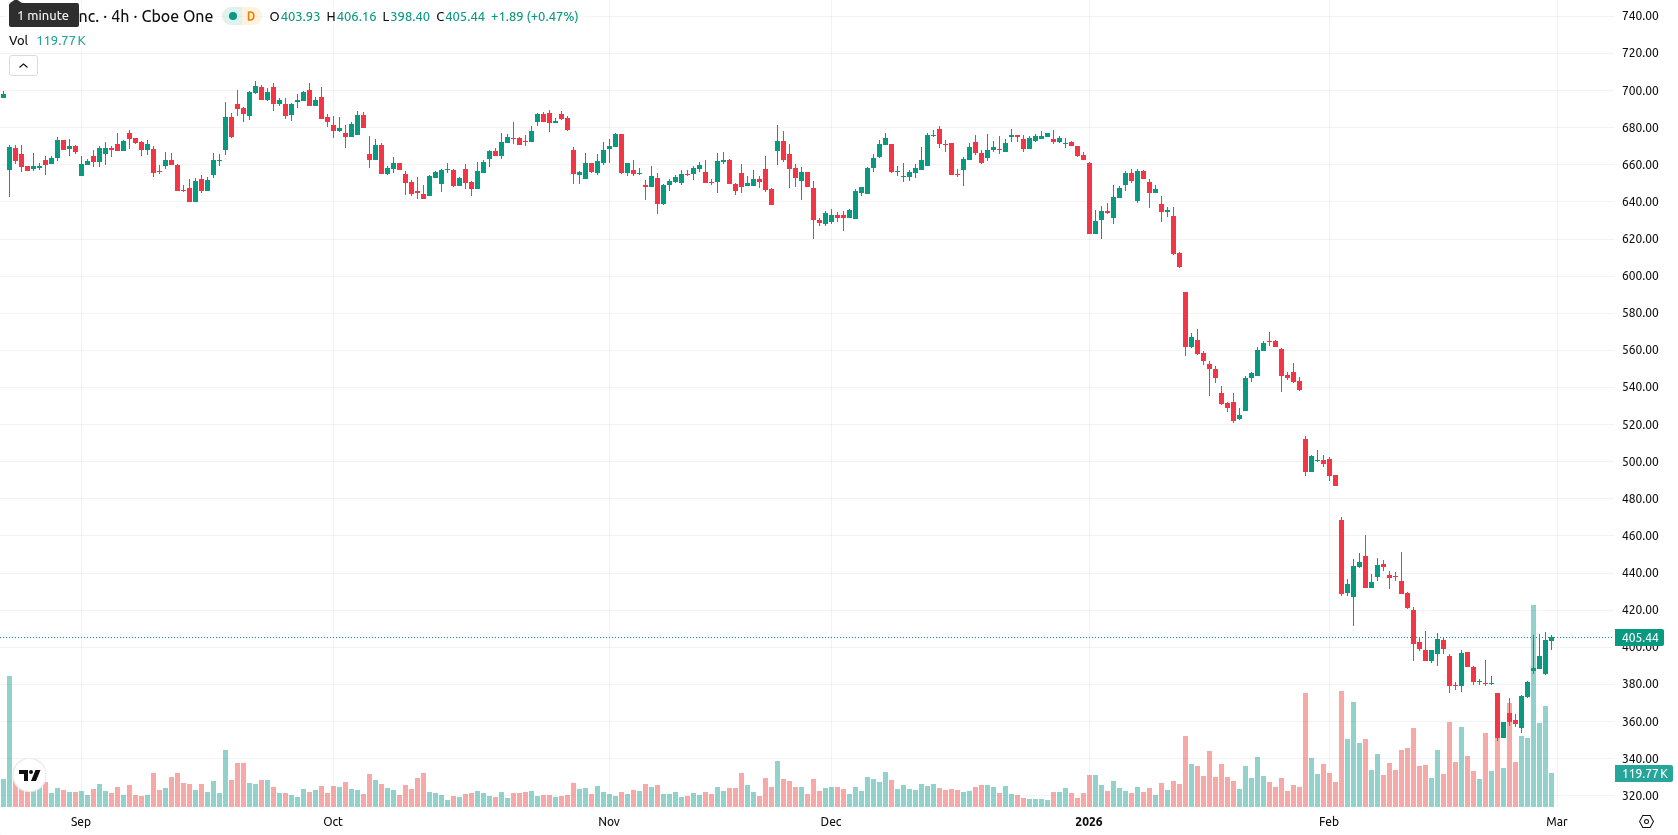
Intuit Inc. (INTU) is trading at $409.18 after rising 3.74% today. The price remains below the MA-20 at $416.39, as well as the more distant MA-50 at $538.79 and MA-200 at $661.76, indicating ongoing short- and medium-term downward momentum with current levels far beneath long-term moving averages.
Highlights
- Intuit reported fiscal Q2 2026 revenue of $4.7 billion, up 17% year-over-year, and non-GAAP operating income of $1.5 billion.
- The company raised its quarterly dividend by 15% to $1.20 per share and announced new AI partnerships with Anthropic and OpenAI.
- INTU trades at $409.18, below key moving averages; technicals indicate short- to medium-term downward pressure with $388–$430 as the likely trading range.
Dividend hike and AI partnerships as guidance holds despite Mailchimp drop
On February 26, 2026, Intuit reported fiscal Q2 2026 earnings with 17% year-over-year revenue growth to $4.7 billion and non-GAAP operating income climbing to $1.5 billion. The company raised its quarterly dividend by 15% to $1.20 per share, continuing a 15-year streak, and authorized additional share repurchases. New and expanded partnerships with AI firms Anthropic and OpenAI were also announced, along with reaffirmed full-year 2026 revenue guidance despite a modest decline in Mailchimp revenue.
Short-term selling pressure as resistance intensifies amid mixed signals
INTU is currently trading at $409.18, slightly below the MA-20 at $416.39 and well beneath the MA-50 at $538.79 and MA-200 at $661.76. This alignment suggests short- and medium-term downward pressure from sellers, with no long-term support in sight; the Ichimoku Kijun at $459.19 stands as immediate resistance above the market. Momentum indicators paint a complex picture: the daily MACD signals strong selling pressure, while the ADX indicates a firm trend, yet the RSI and CCI remain in oversold or neutral zones. The Stochastic RSI and Bull/Bear Power both signal overbought conditions and persistent buyer dominance intraday, but the Awesome Oscillator remains neutral.
Further downside likely as bullish breakout odds remain low
For the coming week, the price is expected to fluctuate within a typical volatility band between $388 and $430 relative to current levels. The probability of a sustained move higher is low (under 20%), so further declines are more likely in the prevailing trend. In the baseline scenario, consolidation between recent lows and resistance prevails. A close above the Ichimoku Kijun at $459.19 would be needed for bullish momentum, while a move below the lower end of the range would confirm ongoing seller dominance on higher timeframes.
Last time, analysts noted that Intuit Inc. was trading below its key moving averages across multiple timeframes, reflecting persistent seller pressure and bearish momentum as indicated by the MACD and ADX, despite a daily gain and increased volatility. While shorter-term signals show some bullish support and oscillators present mixed readings, resistance remains overhead near the MA-20 and Ichimoku levels, with support just below current lows, suggesting the recent bounce may be corrective rather than indicative of a sustained reversal.


-
 Afghanistan
-
 Albania
-
 Algeria
-
 Angola
-
 Argentina
-
 Armenia
-
 Australia
-
 Austria
-
 Azerbaijan
-
 Bahamas
-
 Bahrain
-
 Bangladesh
-
 Belarus
-
 Belgium
-
 Bolivia
-
 Botswana
-
 Brazil
-
 Brunei
-
 Bulgaria
-
 Cambodia
-
 Cameroon
-
 Canada
-
 Chile
Chile
-
 China
China
-
 Colombia
-
 Congo
Congo
-
 Costa Rica
-
 Cote d'Ivoire
-
 Croatia
-
 Cuba
Cuba
-
 Cyprus
-
 Czechia
-
 DR Congo
-
 Denmark
-
 Dominican Republic
-
 Ecuador
-
 Egypt
Egypt
-
 El Salvador
-
 Estonia
-
 Eswatini
-
 Ethiopia
-
 Finland
-
 France
-
 Georgia
-
 Germany
-
 Ghana
Ghana
-
 Greece
-
 Haiti
Haiti
-
 Hong Kong
-
 Hungary
-
 India
India
-
 Indonesia
-
 Iran, Islamic republic
-
 Iraq
Iraq
-
 Ireland
-
 Israel
-
 Italy
Italy
-
 Jamaica
-
 Japan
Japan
-
 Jordan
-
 Kazakhstan
-
 Kenya
Kenya
-
 Korea
Korea
-
 Kuwait
-
 Kyrgyzstan
-
 Laos
Laos
-
 Latvia
-
 Lebanon
-
 Lesotho
-
 Libya
Libya
-
 Lithuania
-
 Luxembourg
-
 Madagascar
-
 Malaysia
-
 Malta
Malta
-
 Mauritius
-
 Mexico
-
 Moldova
-
 Mongolia
-
 Montenegro
-
 Morocco
-
 Mozambique
-
 Myanmar
-
 Namibia
-
 Nepal
Nepal
-
 Netherlands
-
 New Zealand
-
 Nigeria
-
 North Macedonia
-
 Norway
-
 Oman
Oman
-
 Pakistan
-
 Palestine
-
 Panama
-
 Papua New Guinea
-
 Paraguay
-
 Peru
Peru
-
 Philippines
-
 Poland
-
 Portugal
-
 Puerto Rico
-
 Qatar
Qatar
-
 Reunion
-
 Romania
-
 Rwanda
-
 Saudi Arabia
-
 Serbia
-
 Singapore
-
 Slovakia
-
 Slovenia
-
 Somalia
-
 South Africa
-
 Spain
Spain
-
 Sri Lanka
-
 Sweden
-
 Switzerland
-
 Syria
Syria
-
 Taiwan
-
 Tajikistan
-
 Tanzania
-
 Thailand
-
 Trinidad and Tobago
-
 Tunisia
-
 Turkey
-
 UAE
UAE
-
 Uganda
-
 Ukraine
-
 United Kingdom
-
United States
-
 Uruguay
-
 Uzbekistan
-
 Venezuela
-
 Vietnam
-
 Yemen
Yemen
-
 Zambia
-
 Zimbabwe
- Forex
- Crypto
