
Mixed technical signals and revenue jump — Apple stock slips 3.24%

Apple Inc. (AAPL) is trading at $264.12, down 3.24% for the day. The share price is currently positioned below the MA-20 at $268.70 and the MA-50 at $265.38, while holding above its long-term MA-200 at $242.91.
AAPL price prediction
Current price:
$ 291.44
-4.1900
1.42%
Closed
06/12
Daily range
289.66
 293.21
Weekly range
287.38
317.40
Loading...
Highlights
- Apple reported a 16% year-over-year revenue increase to $143.8 billion and a 19% EPS rise to $2.84 for the January 27, 2025 quarter, driven by iPhone 17 demand.
- Services revenue hit a record $30 billion, up 14%, with $54 billion in operating cash flow and $32 billion returned to shareholders via buybacks and dividends.
- Apple shares closed at $264.12, trading below the MA-20 at $268.70 and MA-50 at $265.38, indicating short-term seller pressure, with support at $260–$262 and a 75% probability of rebound toward $270.
Robust iPhone sales and buybacks meet ongoing shareholder selling
Apple reported quarterly results with revenue increasing 16% year-over-year to $143.8 billion and diluted earnings per share rising 19% to $2.84 for the quarter ended January 27, 2025. iPhone revenue grew 23%, driven by strong demand for the iPhone 17 series, and Services division revenue reached a record $30 billion, up 14%. The company generated $54 billion in operating cash flow and returned $32 billion to shareholders through buybacks and dividends, including a recent quarterly dividend of $0.26 per share. Institutional investors disclosed increased or adjusted holdings in Apple leading up to the March 4, 2026 event, though price action has remained under broader selling pressure.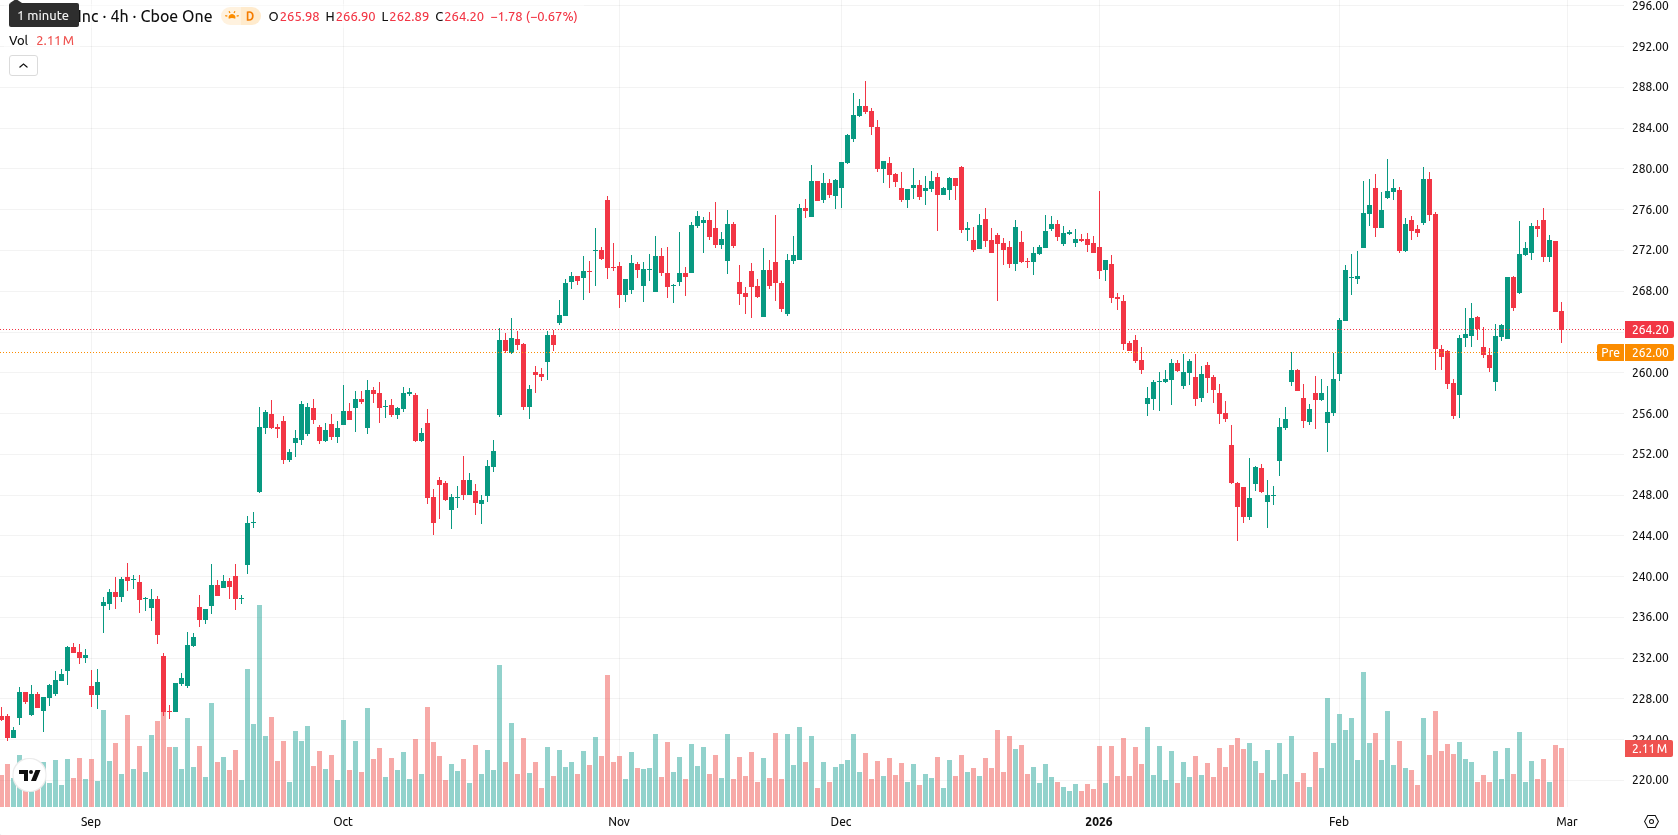
Mixed momentum persists as long-term support holds amid weak trend
Technically, AAPL is under near-term and intermediate selling pressure given its position below both the MA-20 and MA-50, with long-term uptrend support from the MA-200 holding firm. The Ichimoku Kijun at $262.78 acts as near-term resistance; immediate support is just above this level. Momentum indicators are mixed: daily MACD signals a buy while ADX shows a weak trend, with the RSI at 47.57 indicating selling territory, Stochastic RSI is oversold, and CCI is neutral but close to oversold. Bull/Bear Power on the daily chart is overbought, but intraday momentum clearly favors sellers. The Awesome Oscillator signals 'buy' on the daily timeframe but is unsupported on shorter intervals. Persistent seller activity dominates intraday, while oversold oscillators create a technical divergence.Upside bias grows with resistance test as downside risks diminish
Over the next five trading days, AAPL is expected to move within a typical volatility band of $260 to $270. The probability of a move higher is elevated at around 75%, while further downside is less likely given support from longer-term trends. Sideways consolidation in this range is anticipated, with resistance at $265–$268 and support near $260. A bullish scenario would be confirmed on a break above resistance toward $270, while a move below $262 could target $260, though sustained selling is considered less probable.
Viktoras Karapetjanc, expert at Traders Union, sees Apple’s robust fundamentals and strong revenue momentum as positive signs despite recent selling pressure. He notes that institutional flows and growing iPhone and Services revenues provide a solid macro and sentiment base. The analyst believes near-term price consolidation is likely, but expects long-term support to hold. Upside probability remains strong in the $260–$270 range. "With Apple’s solid fundamentals and resilient demand, I see current weakness as an opportunity for medium-term buyers to position for renewed strength above $265."
Previously it was reported that Apple Inc. traded just below its short-term moving average but remained above key medium- and long-term supports, reflecting minor resistance and an overall constructive technical posture bolstered by strong dynamic backing around the Ichimoku Kijun. Momentum indicators presented a mixed outlook, with positive MACD signaling potential upside amid ongoing selling pressure, while oscillators and ADX pointed to weak trend strength and short-term oversold conditions.
Source of Data:
AAPL Price Analysis by TU
The analysis is based on a proprietary model combining technical, on-chain, and expert data. Not investment advice. See
methodology
The information is based on forecasts and does not constitute investment advice or a guarantee of future results. Market conditions may change. See our Disclaimer and Editorial Integrity for details.
Subscribe to TU news
Did you like the article?


Weekly Top Bonuses

Top News


Top 5 companies for you

United States
-
 Afghanistan
-
 Albania
-
 Algeria
-
 Angola
-
 Argentina
-
 Armenia
-
 Australia
-
 Austria
-
 Azerbaijan
-
 Bahamas
-
 Bahrain
-
 Bangladesh
-
 Belarus
-
 Belgium
-
 Bolivia
-
 Botswana
-
 Brazil
-
 Brunei
-
 Bulgaria
-
 Cambodia
-
 Cameroon
-
 Canada
-
 Chile
Chile
-
 China
China
-
 Colombia
-
 Congo
Congo
-
 Costa Rica
-
 Cote d'Ivoire
-
 Croatia
-
 Cuba
Cuba
-
 Cyprus
-
 Czechia
-
 DR Congo
-
 Denmark
-
 Dominican Republic
-
 Ecuador
-
 Egypt
Egypt
-
 El Salvador
-
 Estonia
-
 Eswatini
-
 Ethiopia
-
 Finland
-
 France
-
 Georgia
-
 Germany
-
 Ghana
Ghana
-
 Greece
-
 Haiti
Haiti
-
 Hong Kong
-
 Hungary
-
 India
India
-
 Indonesia
-
 Iran, Islamic republic
-
 Iraq
Iraq
-
 Ireland
-
 Israel
-
 Italy
Italy
-
 Jamaica
-
 Japan
Japan
-
 Jordan
-
 Kazakhstan
-
 Kenya
Kenya
-
 Korea
Korea
-
 Kuwait
-
 Kyrgyzstan
-
 Laos
Laos
-
 Latvia
-
 Lebanon
-
 Lesotho
-
 Libya
Libya
-
 Lithuania
-
 Luxembourg
-
 Madagascar
-
 Malaysia
-
 Malta
Malta
-
 Mauritius
-
 Mexico
-
 Moldova
-
 Mongolia
-
 Montenegro
-
 Morocco
-
 Mozambique
-
 Myanmar
-
 Namibia
-
 Nepal
Nepal
-
 Netherlands
-
 New Zealand
-
 Nigeria
-
 North Macedonia
-
 Norway
-
 Oman
Oman
-
 Pakistan
-
 Palestine
-
 Panama
-
 Papua New Guinea
-
 Paraguay
-
 Peru
Peru
-
 Philippines
-
 Poland
-
 Portugal
-
 Puerto Rico
-
 Qatar
Qatar
-
 Reunion
-
 Romania
-
 Rwanda
-
 Saudi Arabia
-
 Serbia
-
 Singapore
-
 Slovakia
-
 Slovenia
-
 Somalia
-
 South Africa
-
 Spain
Spain
-
 Sri Lanka
-
 Sweden
-
 Switzerland
-
 Syria
Syria
-
 Taiwan
-
 Tajikistan
-
 Tanzania
-
 Thailand
-
 Trinidad and Tobago
-
 Tunisia
-
 Turkey
-
 UAE
UAE
-
 Uganda
-
 Ukraine
-
 United Kingdom
-
United States
-
 Uruguay
-
 Uzbekistan
-
 Venezuela
-
 Vietnam
-
 Yemen
Yemen
-
 Zambia
-
 Zimbabwe
- Forex
- Crypto
Live News
