
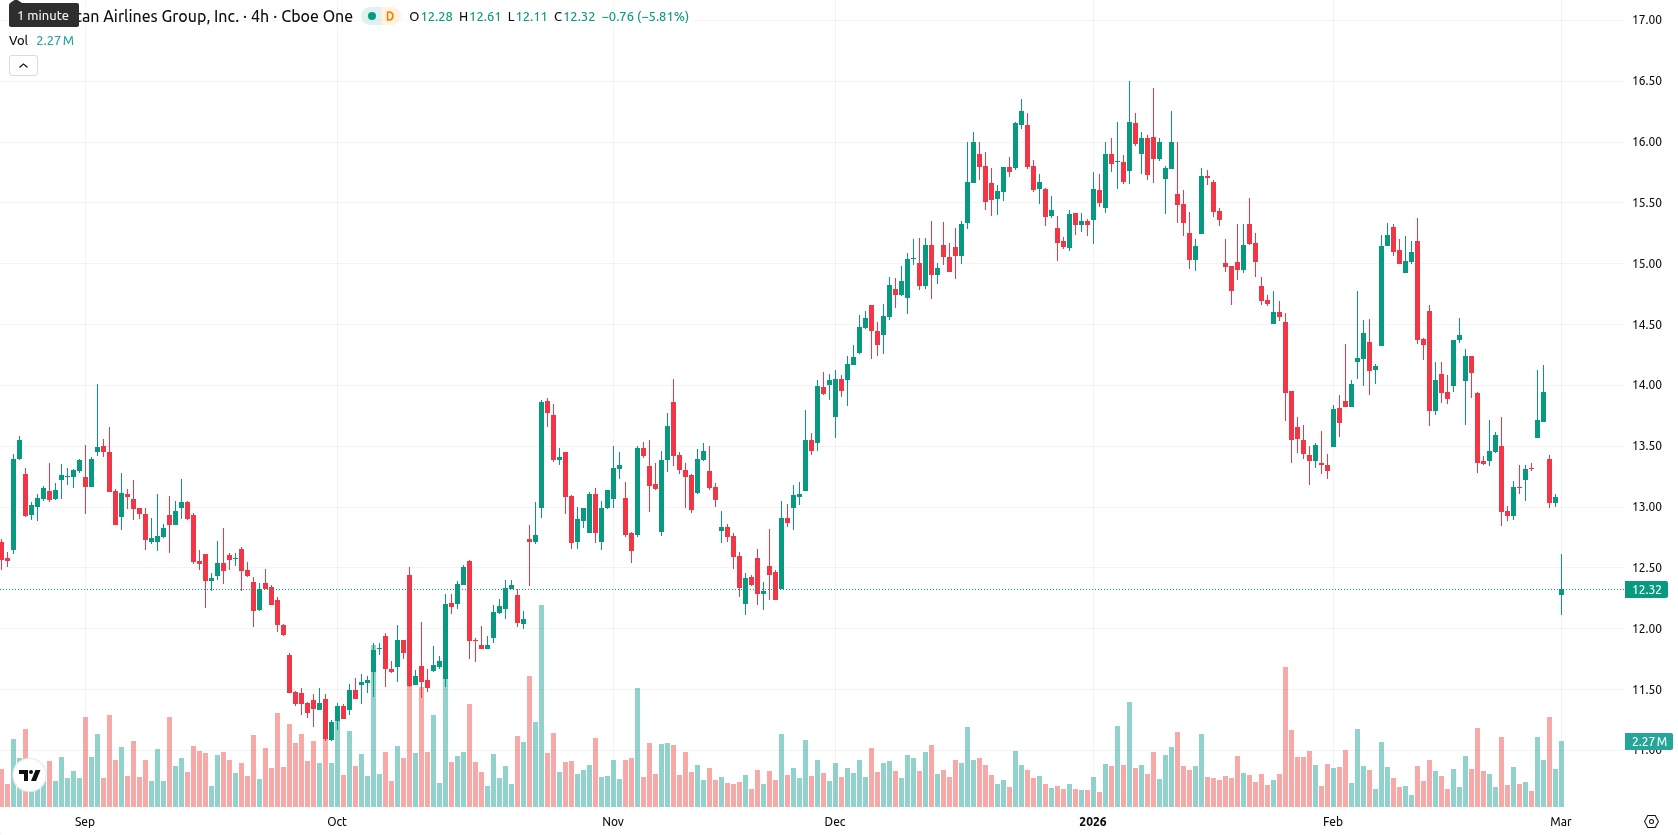
American Airlines stock falls 4.13% as downside momentum builds amid oversold signals

American Airlines Group Inc. (AAL) is trading at $12.53 after a 4.13% decline on the day. The price remains below both the MA-20 ($13.95) and MA-50 ($14.75), and just beneath the MA-200 ($12.96), reflecting persistent short- and medium-term selling pressure while testing long-term support near the MA-200.
Highlights
- AAL trades at $12.53, well below its MA-20 ($13.95) and MA-50 ($14.75), indicating sustained short- and medium-term selling pressure.
- Bearish momentum dominates as MACD signals 'sell', ADX trend remains weak, and oversold readings are confirmed by RSI (41.22), Stochastic RSI (23.04), and CCI (-108.16).
- For the next five sessions, AAL is expected to consolidate between $12.40–$12.80, with resistance at $13.00–$13.10 and breakdown risk below $12.40.
Bearish momentum persists as key indicators signal oversold levels
AAL is currently trading well below its MA-20 and MA-50, but just under the MA-200, suggesting that while short- and medium-term momentum remains bearish, the MA-200 could offer some degree of support. The Ichimoku Kijun at $14.20 acts as immediate resistance. Indicators on the daily timeframe are uniformly negative: MACD shows a sell signal, ADX is low (weak trend), and RSI (41.22), Stochastic RSI (23.04), and CCI (-108.16) all suggest oversold conditions. Bull/Bear Power is negative at -0.28, and today's session began with a sharp gap down from $13.07 to $12.26, with trading taking place around the midpoint of a volatile intraday range ($12.12–$12.61). These technical factors confirm sustained downside momentum.
Limited upside potential as volatility range favors consolidation
Over the next five trading days, AAL is expected to remain within a typical volatility band of $12.40 to $12.80, with the likelihood of upward movement under 20%. Sideways action between $12.40 and $12.80 is the baseline scenario, as further downside or consolidation is more probable. A break above immediate resistance at $13.00–$13.10 could trigger a bullish move, while a fall below $12.40 would open up the potential for additional losses.
Previously it was reported that American Airlines Group is trading below its key short-, medium-, and long-term moving averages, with sustained bearish pressure and downward momentum reinforced by dynamic resistance from the Ichimoku cloud. Momentum and intraday indicators, including MACD, RSI, and several oscillators, point to oversold and seller-dominated conditions, suggesting bearish control persists amid low volatility, though oversold signals may prompt a temporary technical rebound if buyers emerge.


Latest American Airlines News


-
 Afghanistan
-
 Albania
-
 Algeria
-
 Angola
-
 Argentina
-
 Armenia
-
 Australia
-
 Austria
-
 Azerbaijan
-
 Bahamas
-
 Bahrain
-
 Bangladesh
-
 Belarus
-
 Belgium
-
 Bolivia
-
 Botswana
-
 Brazil
-
 Brunei
-
 Bulgaria
-
 Cambodia
-
 Cameroon
-
 Canada
-
 Chile
Chile
-
 China
China
-
 Colombia
-
 Congo
Congo
-
 Costa Rica
-
 Cote d'Ivoire
-
 Croatia
-
 Cuba
Cuba
-
 Cyprus
-
 Czechia
-
 DR Congo
-
 Denmark
-
 Dominican Republic
-
 Ecuador
-
 Egypt
Egypt
-
 El Salvador
-
 Estonia
-
 Eswatini
-
 Ethiopia
-
 Finland
-
 France
-
 Georgia
-
 Germany
-
 Ghana
Ghana
-
 Greece
-
 Haiti
Haiti
-
 Hong Kong
-
 Hungary
-
 India
India
-
 Indonesia
-
 Iran, Islamic republic
-
 Iraq
Iraq
-
 Ireland
-
 Israel
-
 Italy
Italy
-
 Jamaica
-
 Japan
Japan
-
 Jordan
-
 Kazakhstan
-
 Kenya
Kenya
-
 Korea
Korea
-
 Kuwait
-
 Kyrgyzstan
-
 Laos
Laos
-
 Latvia
-
 Lebanon
-
 Lesotho
-
 Libya
Libya
-
 Lithuania
-
 Luxembourg
-
 Madagascar
-
 Malaysia
-
 Malta
Malta
-
 Mauritius
-
 Mexico
-
 Moldova
-
 Mongolia
-
 Montenegro
-
 Morocco
-
 Mozambique
-
 Myanmar
-
 Namibia
-
 Nepal
Nepal
-
 Netherlands
-
 New Zealand
-
 Nigeria
-
 North Macedonia
-
 Norway
-
 Oman
Oman
-
 Pakistan
-
 Palestine
-
 Panama
-
 Papua New Guinea
-
 Paraguay
-
 Peru
Peru
-
 Philippines
-
 Poland
-
 Portugal
-
 Puerto Rico
-
 Qatar
Qatar
-
 Reunion
-
 Romania
-
 Rwanda
-
 Saudi Arabia
-
 Serbia
-
 Singapore
-
 Slovakia
-
 Slovenia
-
 Somalia
-
 South Africa
-
 Spain
Spain
-
 Sri Lanka
-
 Sweden
-
 Switzerland
-
 Syria
Syria
-
 Taiwan
-
 Tajikistan
-
 Tanzania
-
 Thailand
-
 Trinidad and Tobago
-
 Tunisia
-
 Turkey
-
 UAE
UAE
-
 Uganda
-
 Ukraine
-
 United Kingdom
-
United States
-
 Uruguay
-
 Uzbekistan
-
 Venezuela
-
 Vietnam
-
 Yemen
Yemen
-
 Zambia
-
 Zimbabwe
- Forex
- Crypto
