
AMD shows mixed momentum below key MA-20 resistance, with price anchored above MA-50 support – weekly forecast

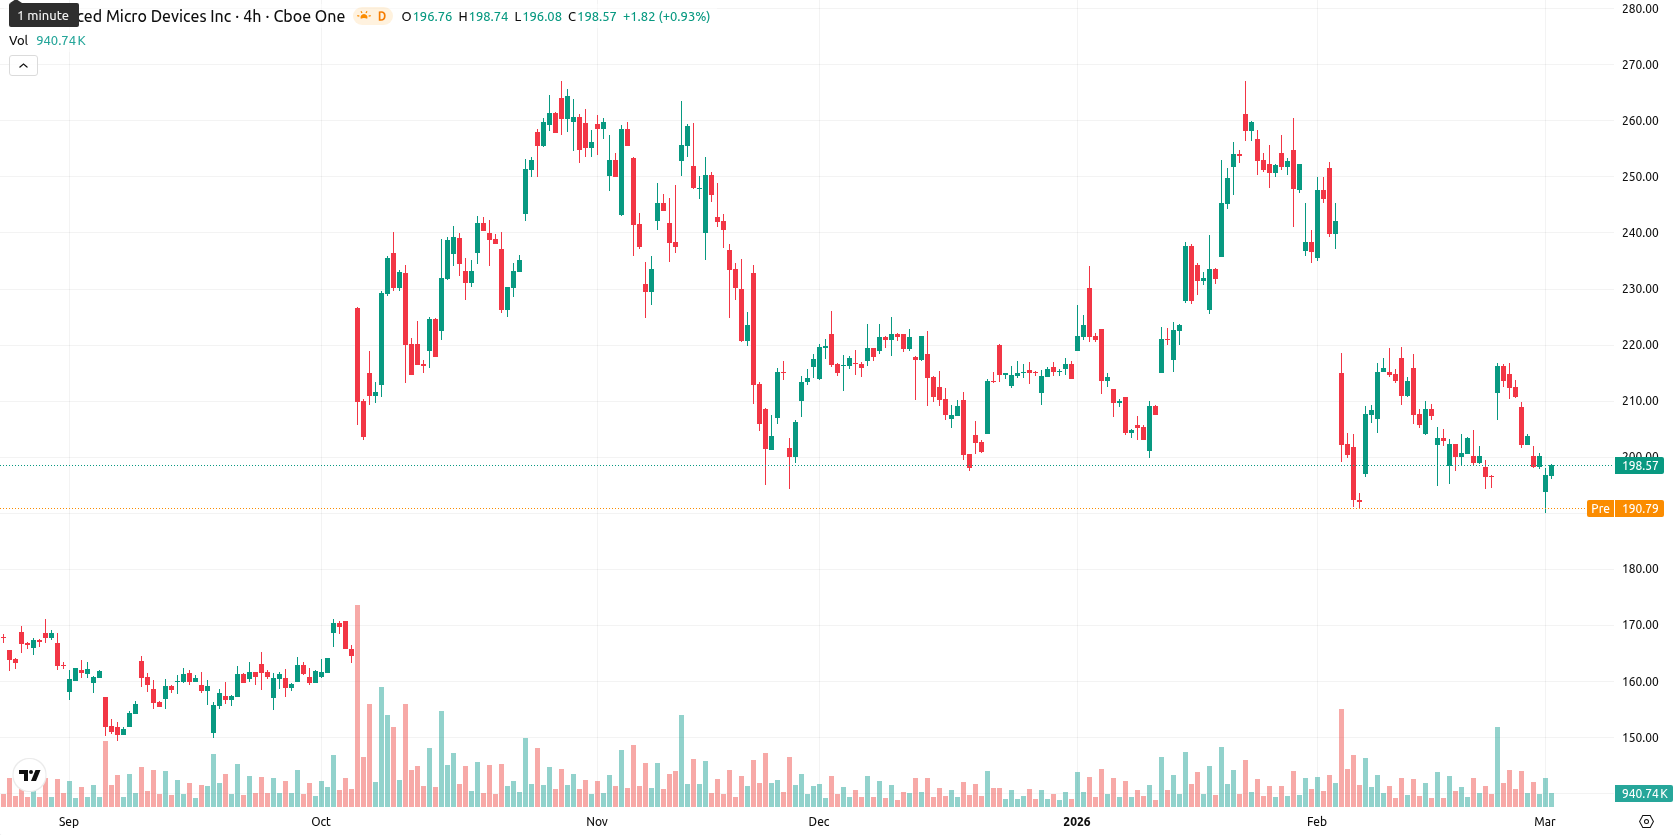
Advanced Micro Devices, Inc. (AMD) closed the week at $198.62, marking a steady decline of $1.59 or 0.79% from the prior week’s $200.21. The asset remains below the weekly MA-20 at $221.84, indicating near-term weakness, but is still positioned above both the MA-50 at $172.94 and the MA-200 at $131.48, which highlights the persistence of a medium- to long-term bullish trend.
Highlights
- AMD trades at $198.62, positioned below the weekly MA-20 at $221.84 but above MA-50 at $172.94, indicating short-term selling pressure despite a bullish medium-term trend.
- Technical momentum is mixed with a strong MACD buy signal and oversold RSI, Stochastic RSI, and CCI, while the ADX indicates weak trend conviction for continued declines.
- Price action is expected to consolidate between $190.00 and $212.00 next week, with a bullish breakout above $208.15 or further downside risk below $190.00.
Seller exhaustion signals emerge as technicals diverge during the week
On the weekly chart, AMD’s price remains under the MA-20 resistance and the Ichimoku Kijun at $208.15 while sitting securely above the MA-50 dynamic support at $172.94. Weekly volatility reached 14.06%, showing significant range while the price consolidated in the lower part of the recent band. The MACD on W1 continues to deliver a strong buy signal, yet this is contradicted by weak ADX trend confirmation and multiple oscillators — RSI, Stochastic RSI, and CCI — all reflecting pronounced oversold conditions. The oversold readings of Bull/Bear Power reinforce the week’s seller dominance, suggesting further potential exhaustion among sellers.
Limited recovery outlook as weak upside momentum shapes next week’s range
Looking into the next 5–7 trading days, AMD is expected to fluctuate within a corridor of $190.00 to $212.00, tracking realistic volatility. Only the MACD and support at MA-50 present signs of upside strength, while the prevailing oversold oscillator signals and low ADX trend strength point to limited recovery prospects and sustained downside risk. The probability of a bullish break above $208.15 toward $212.00 is viewed as low (less than 20%), while any move below $190.00 could trigger tests of the lower $190s; however, deep oversold readings may slow or limit further declines. The most likely outcome is consolidation near current levels until key indicators resolve their divergence.
Previously it was reported that AMD is trading below its short- and medium-term moving averages with strong downward momentum, while remaining above long-term support, as key indicators such as the MACD and RSI point to bearish conditions and ongoing seller dominance. Immediate resistance is positioned well above the current level, and unless a decisive move above consolidation bands occurs, the probability of further downside or sideways movement remains elevated.


-
 Afghanistan
-
 Albania
-
 Algeria
-
 Angola
-
 Argentina
-
 Armenia
-
 Australia
-
 Austria
-
 Azerbaijan
-
 Bahamas
-
 Bahrain
-
 Bangladesh
-
 Belarus
-
 Belgium
-
 Bolivia
-
 Botswana
-
 Brazil
-
 Brunei
-
 Bulgaria
-
 Cambodia
-
 Cameroon
-
 Canada
-
 Chile
Chile
-
 China
China
-
 Colombia
-
 Congo
Congo
-
 Costa Rica
-
 Cote d'Ivoire
-
 Croatia
-
 Cuba
Cuba
-
 Cyprus
-
 Czechia
-
 DR Congo
-
 Denmark
-
 Dominican Republic
-
 Ecuador
-
 Egypt
Egypt
-
 El Salvador
-
 Estonia
-
 Eswatini
-
 Ethiopia
-
 Finland
-
 France
-
 Georgia
-
 Germany
-
 Ghana
Ghana
-
 Greece
-
 Haiti
Haiti
-
 Hong Kong
-
 Hungary
-
 India
India
-
 Indonesia
-
 Iran, Islamic republic
-
 Iraq
Iraq
-
 Ireland
-
 Israel
-
 Italy
Italy
-
 Jamaica
-
 Japan
Japan
-
 Jordan
-
 Kazakhstan
-
 Kenya
Kenya
-
 Korea
Korea
-
 Kuwait
-
 Kyrgyzstan
-
 Laos
Laos
-
 Latvia
-
 Lebanon
-
 Lesotho
-
 Libya
Libya
-
 Lithuania
-
 Luxembourg
-
 Madagascar
-
 Malaysia
-
 Malta
Malta
-
 Mauritius
-
 Mexico
-
 Moldova
-
 Mongolia
-
 Montenegro
-
 Morocco
-
 Mozambique
-
 Myanmar
-
 Namibia
-
 Nepal
Nepal
-
 Netherlands
-
 New Zealand
-
 Nigeria
-
 North Macedonia
-
 Norway
-
 Oman
Oman
-
 Pakistan
-
 Palestine
-
 Panama
-
 Papua New Guinea
-
 Paraguay
-
 Peru
Peru
-
 Philippines
-
 Poland
-
 Portugal
-
 Puerto Rico
-
 Qatar
Qatar
-
 Reunion
-
 Romania
-
 Rwanda
-
 Saudi Arabia
-
 Serbia
-
 Singapore
-
 Slovakia
-
 Slovenia
-
 Somalia
-
 South Africa
-
 Spain
Spain
-
 Sri Lanka
-
 Sweden
-
 Switzerland
-
 Syria
Syria
-
 Taiwan
-
 Tajikistan
-
 Tanzania
-
 Thailand
-
 Trinidad and Tobago
-
 Tunisia
-
 Turkey
-
 UAE
UAE
-
 Uganda
-
 Ukraine
-
 United Kingdom
-
United States
-
 Uruguay
-
 Uzbekistan
-
 Venezuela
-
 Vietnam
-
 Yemen
Yemen
-
 Zambia
-
 Zimbabwe
- Forex
- Crypto
