
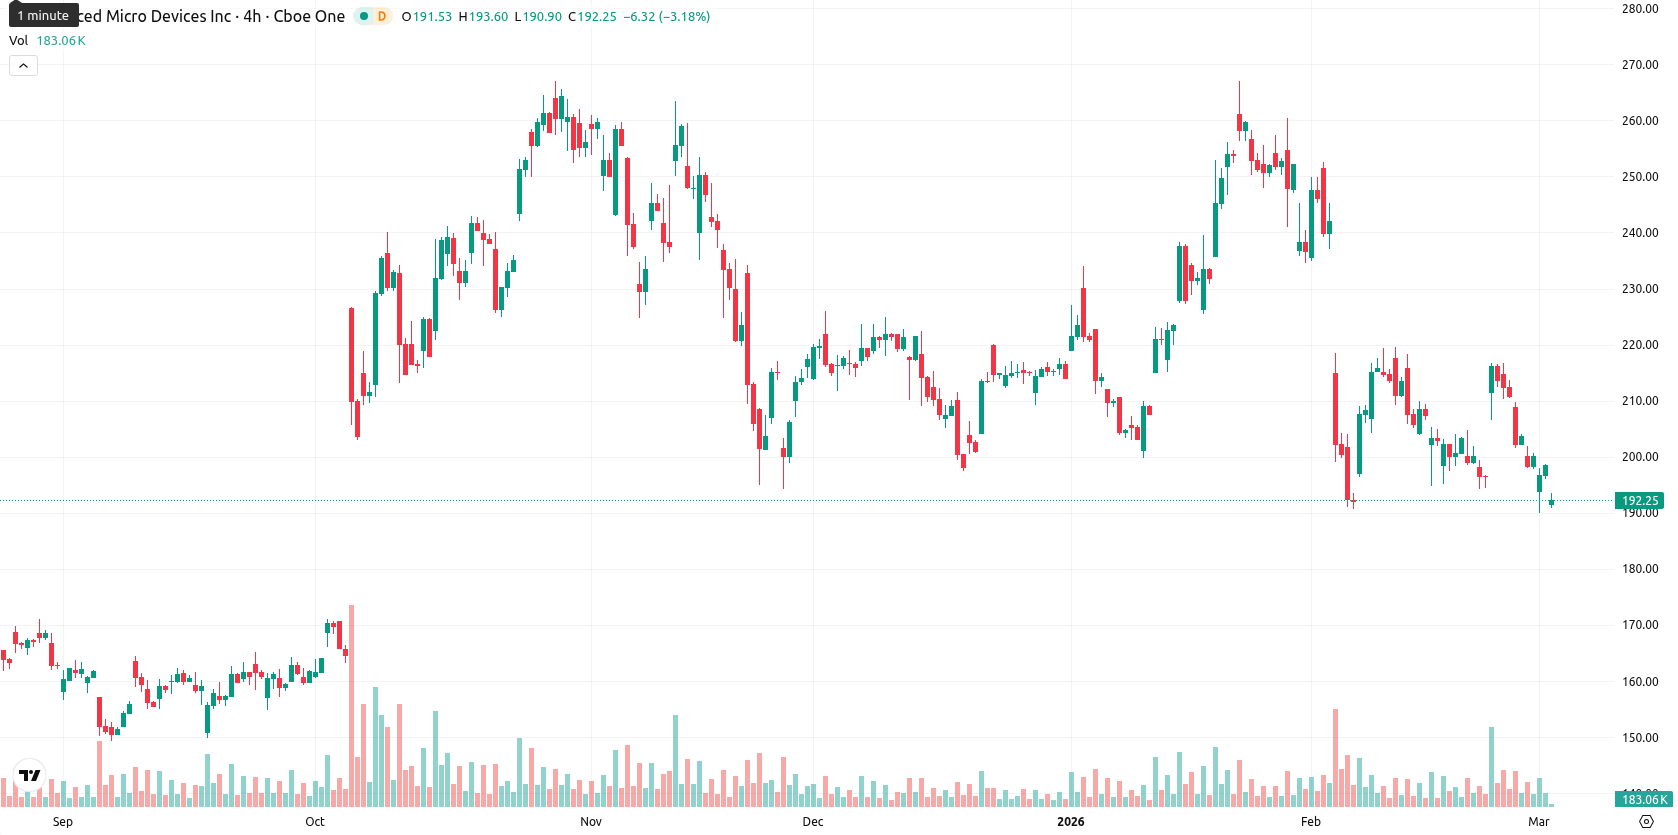
AMD stock falls 3.60% as sellers dominate and signals point to further downside

Advanced Micro Devices, Inc. (AMD) is trading at $191.47, below the MA-20 at $208.82 and MA-50 at $218.46, but still above the MA-200 at $187.01. This combination reflects continued short- to mid-term pressure from sellers, while the long-term trend still finds support above the 200-day Moving Average. The Ichimoku Kijun stands at $228.45, serving as immediate resistance.
Highlights
- AMD trades at $191.47, below its MA-20 ($208.82) and MA-50 ($218.46), indicating continued short- to mid-term selling pressure.
- Momentum is bearish, with MACD in sell mode, weak ADX, and intraday indicators such as RSI, Stoch RSI, and CCI showing mild oversold conditions.
- A decisive downside break below the MA-200 at $187.01 risks extending losses toward $183, while upside probability above $200 remains below 20% for the next five sessions.
Bearish momentum confirmed amid persistent downside after gap down
Momentum has turned bearish, confirmed by MACD in sell mode and a low ADX reading, indicating a weak trend. RSI, Stochastic RSI, and CCI all point to mild oversold conditions or underlying weakness, while Bull/Bear Power signals pronounced seller dominance intraday. The Awesome Oscillator further supports the negative trend. The session opened with a notable gap down from $198.62 to $191.40 and remains near the session lows of $190.91 in a relatively narrow daily range, reflecting moderate volatility and persistent downside pressure after the open. Most momentum signals confirm the bearish intraday tone, though there is a mild divergence from Stochastic RSI that hints at oversold conditions.
Downside risk elevated as break below 200-day average looms
Looking ahead five trading sessions, the expected price range is between $183 and $200. The probability of a move upward is very low (less than 20%), making further downside more likely in the short term. The baseline scenario sees AMD fluctuating sideways between $183 and $200. A bullish scenario would require a close above the $200 area and a strong push through immediate resistance near the Ichimoku Kijun at $228.45, but current signals make this unlikely. The bearish scenario plays out if the price breaks below the MA-200 at $187.01, exposing additional downside risk toward the lower end of the volatility band relative to current levels.
Last time, analysts noted that AMD closed the week below its short-term moving averages and key resistance levels, signaling near-term weakness, while still maintaining a bullish stance above medium- and long-term supports. Despite a strong MACD buy signal, multiple oscillators including the RSI indicate oversold conditions and weak trend strength, suggesting limited recovery potential and a likely period of consolidation near current levels.


-
 Afghanistan
-
 Albania
-
 Algeria
-
 Angola
-
 Argentina
-
 Armenia
-
 Australia
-
 Austria
-
 Azerbaijan
-
 Bahamas
-
 Bahrain
-
 Bangladesh
-
 Belarus
-
 Belgium
-
 Bolivia
-
 Botswana
-
 Brazil
-
 Brunei
-
 Bulgaria
-
 Cambodia
-
 Cameroon
-
 Canada
-
 Chile
Chile
-
 China
China
-
 Colombia
-
 Congo
Congo
-
 Costa Rica
-
 Cote d'Ivoire
-
 Croatia
-
 Cuba
Cuba
-
 Cyprus
-
 Czechia
-
 DR Congo
-
 Denmark
-
 Dominican Republic
-
 Ecuador
-
 Egypt
Egypt
-
 El Salvador
-
 Estonia
-
 Eswatini
-
 Ethiopia
-
 Finland
-
 France
-
 Georgia
-
 Germany
-
 Ghana
Ghana
-
 Greece
-
 Haiti
Haiti
-
 Hong Kong
-
 Hungary
-
 India
India
-
 Indonesia
-
 Iran, Islamic republic
-
 Iraq
Iraq
-
 Ireland
-
 Israel
-
 Italy
Italy
-
 Jamaica
-
 Japan
Japan
-
 Jordan
-
 Kazakhstan
-
 Kenya
Kenya
-
 Korea
Korea
-
 Kuwait
-
 Kyrgyzstan
-
 Laos
Laos
-
 Latvia
-
 Lebanon
-
 Lesotho
-
 Libya
Libya
-
 Lithuania
-
 Luxembourg
-
 Madagascar
-
 Malaysia
-
 Malta
Malta
-
 Mauritius
-
 Mexico
-
 Moldova
-
 Mongolia
-
 Montenegro
-
 Morocco
-
 Mozambique
-
 Myanmar
-
 Namibia
-
 Nepal
Nepal
-
 Netherlands
-
 New Zealand
-
 Nigeria
-
 North Macedonia
-
 Norway
-
 Oman
Oman
-
 Pakistan
-
 Palestine
-
 Panama
-
 Papua New Guinea
-
 Paraguay
-
 Peru
Peru
-
 Philippines
-
 Poland
-
 Portugal
-
 Puerto Rico
-
 Qatar
Qatar
-
 Reunion
-
 Romania
-
 Rwanda
-
 Saudi Arabia
-
 Serbia
-
 Singapore
-
 Slovakia
-
 Slovenia
-
 Somalia
-
 South Africa
-
 Spain
Spain
-
 Sri Lanka
-
 Sweden
-
 Switzerland
-
 Syria
Syria
-
 Taiwan
-
 Tajikistan
-
 Tanzania
-
 Thailand
-
 Trinidad and Tobago
-
 Tunisia
-
 Turkey
-
 UAE
UAE
-
 Uganda
-
 Ukraine
-
 United Kingdom
-
United States
-
 Uruguay
-
 Uzbekistan
-
 Venezuela
-
 Vietnam
-
 Yemen
Yemen
-
 Zambia
-
 Zimbabwe
- Forex
- Crypto
