
Meta stock: Strong Q4 earnings and AI chip deal spark upside despite mixed signals

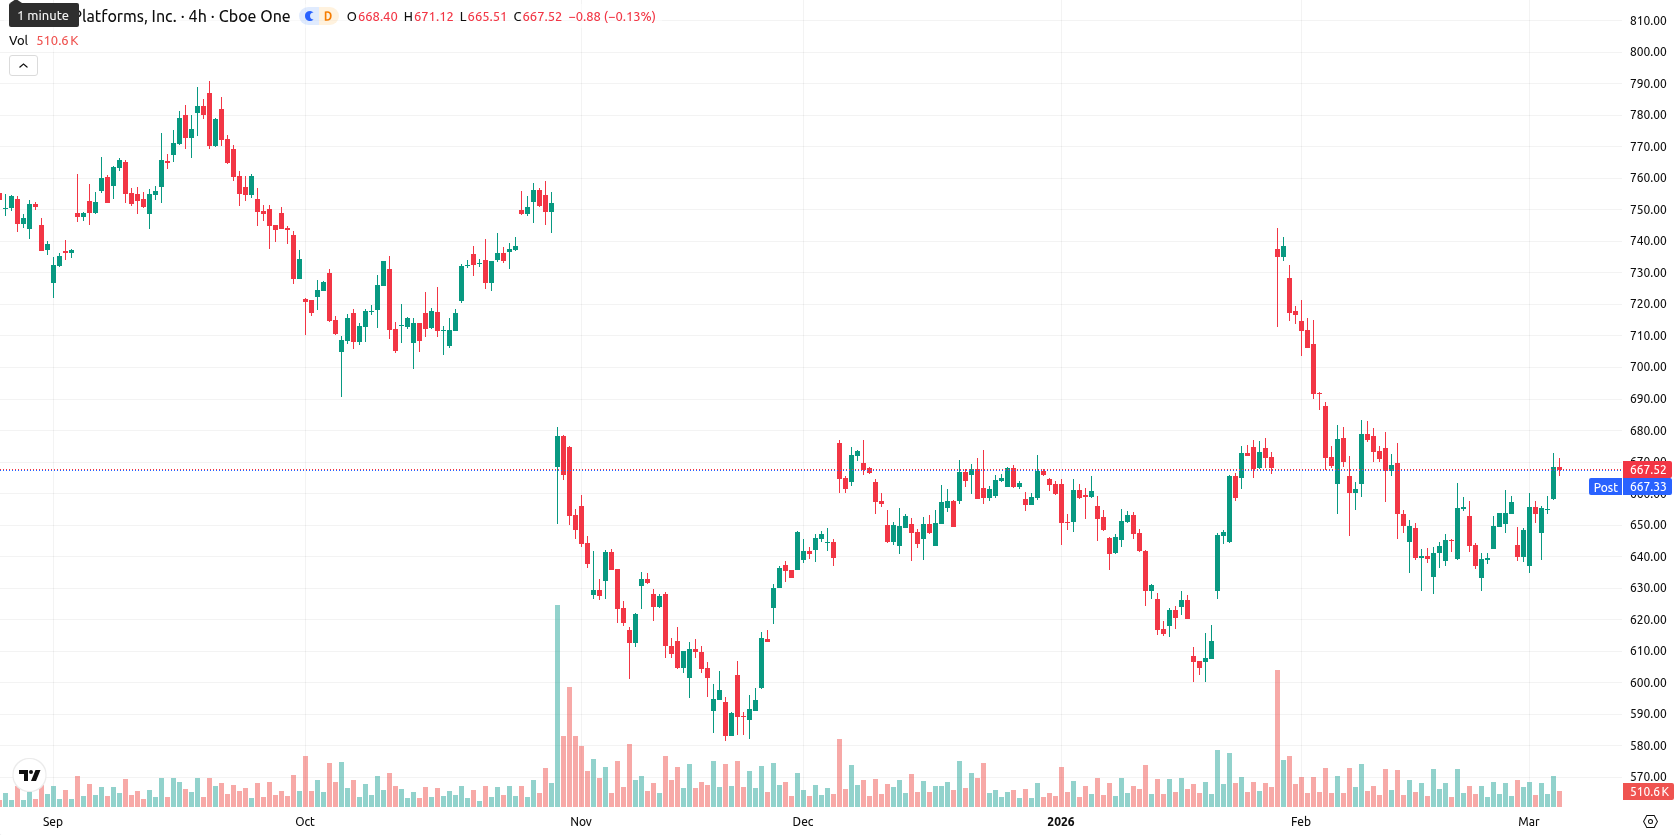
Meta Platforms, Inc. (META, formerly Facebook, Inc.) is trading at $667.75, up 1.93% on the day. The price sits above both the MA-20 ($656.27) and MA-50 ($656.78), reflecting short- to medium-term bullish momentum, but remains below the MA-200 ($691.27), which signals unresolved longer-term resistance.
Highlights
- Meta delivered a 24% year-over-year revenue jump in Q4 2025, fueled by strong AI-powered ad growth.
- Institutional investors trimmed Meta positions, CFO executed a $36.4 million planned share sale, and a $0.525 per share dividend was declared alongside a strategic AMD AI chip deal.
- Technical indicators signal overbought conditions and waning momentum, projecting consolidation between $655 and $680 as downside risk prevails unless resistance at $686 is breached.
Shareholder shifts and AI partnerships amid strong revenue gains
Meta reported a 24% year-over-year revenue increase in Q4 2025, supported by robust performance in AI-driven advertising. Institutional movements included significant share reductions by Arrowstreet Capital and Capital Research Global Investors, while CFO Susan Li executed a $36.4 million planned share sale. Meta also announced a dividend of $0.525 per share for holders of record on March 16, payable March 26, alongside an agreement to purchase artificial intelligence chips from Advanced Micro Devices (AMD), with the option to acquire up to a 10% stake in AMD.
Mixed momentum and resistance as bullish price action defies weak signals
The current price of $667.75 is above both the MA-20 ($656.27) and MA-50 ($656.78), indicating short- to medium-term bullish momentum, but remains below MA-200 ($691.27), signaling unresolved longer-term resistance. The Ichimoku Kijun level at $686.08 stands above the current market, acting as immediate resistance.
Momentum signals are mixed: MACD gives a strong sell on both daily and weekly timeframes, while ADX remains neutral and shows weak trend strength. The Relative Strength Index is near neutral but leans to sell, while Stochastic RSI and Bull/Bear Power both indicate overbought conditions and strong buyer dominance intraday. Commodity Channel Index and Awesome Oscillator are neutral, and daily signals conflict — momentum wanes but buying pressure and price action persist. There was a small opening gap higher, with price now near the top of today's range and intraday volatility at a moderate level. The session shows strength toward the highs, diverging from weakening momentum in the indicators.
Rangebound trading expected as breakout odds remain limited
For the next five days, expect price action in the normalized corridor of $655 to $680, considering current volatility and recent patterns. The probability of an upward move is very low (less than 20%), making further declines more likely. The baseline scenario suggests consolidation between recent highs and lows, with a rangebound profile. A bullish case would require a sustained break above the immediate resistance at $686.08, while a bearish move could develop if support near $655 fails, possibly leading to a sharper retreat toward recent weekly lows.
Previously it was reported that Meta Platforms, Inc. traded below its key 20-, 50-, and 200-day moving averages, with technical indicators such as MACD and ADX reflecting weak or negative momentum, while RSI and CCI remained neutral. Despite an intraday rebound toward session highs, resistance at the Ichimoku Kijun and prevailing selling pressure favor a sideways bias within the $635–$665 range unless a decisive momentum shift occurs.


-
 Afghanistan
-
 Albania
-
 Algeria
-
 Angola
-
 Argentina
-
 Armenia
-
 Australia
-
 Austria
-
 Azerbaijan
-
 Bahamas
-
 Bahrain
-
 Bangladesh
-
 Belarus
-
 Belgium
-
 Bolivia
-
 Botswana
-
 Brazil
-
 Brunei
-
 Bulgaria
-
 Cambodia
-
 Cameroon
-
 Canada
-
 Chile
Chile
-
 China
China
-
 Colombia
-
 Congo
Congo
-
 Costa Rica
-
 Cote d'Ivoire
-
 Croatia
-
 Cuba
Cuba
-
 Cyprus
-
 Czechia
-
 DR Congo
-
 Denmark
-
 Dominican Republic
-
 Ecuador
-
 Egypt
Egypt
-
 El Salvador
-
 Estonia
-
 Eswatini
-
 Ethiopia
-
 Finland
-
 France
-
 Georgia
-
 Germany
-
 Ghana
Ghana
-
 Greece
-
 Haiti
Haiti
-
 Hong Kong
-
 Hungary
-
 India
India
-
 Indonesia
-
 Iran, Islamic republic
-
 Iraq
Iraq
-
 Ireland
-
 Israel
-
 Italy
Italy
-
 Jamaica
-
 Japan
Japan
-
 Jordan
-
 Kazakhstan
-
 Kenya
Kenya
-
 Korea
Korea
-
 Kuwait
-
 Kyrgyzstan
-
 Laos
Laos
-
 Latvia
-
 Lebanon
-
 Lesotho
-
 Libya
Libya
-
 Lithuania
-
 Luxembourg
-
 Madagascar
-
 Malaysia
-
 Malta
Malta
-
 Mauritius
-
 Mexico
-
 Moldova
-
 Mongolia
-
 Montenegro
-
 Morocco
-
 Mozambique
-
 Myanmar
-
 Namibia
-
 Nepal
Nepal
-
 Netherlands
-
 New Zealand
-
 Nigeria
-
 North Macedonia
-
 Norway
-
 Oman
Oman
-
 Pakistan
-
 Palestine
-
 Panama
-
 Papua New Guinea
-
 Paraguay
-
 Peru
Peru
-
 Philippines
-
 Poland
-
 Portugal
-
 Puerto Rico
-
 Qatar
Qatar
-
 Reunion
-
 Romania
-
 Rwanda
-
 Saudi Arabia
-
 Serbia
-
 Singapore
-
 Slovakia
-
 Slovenia
-
 Somalia
-
 South Africa
-
 Spain
Spain
-
 Sri Lanka
-
 Sweden
-
 Switzerland
-
 Syria
Syria
-
 Taiwan
-
 Tajikistan
-
 Tanzania
-
 Thailand
-
 Trinidad and Tobago
-
 Tunisia
-
 Turkey
-
 UAE
UAE
-
 Uganda
-
 Ukraine
-
 United Kingdom
-
United States
-
 Uruguay
-
 Uzbekistan
-
 Venezuela
-
 Vietnam
-
 Yemen
Yemen
-
 Zambia
-
 Zimbabwe
- Forex
- Crypto
