
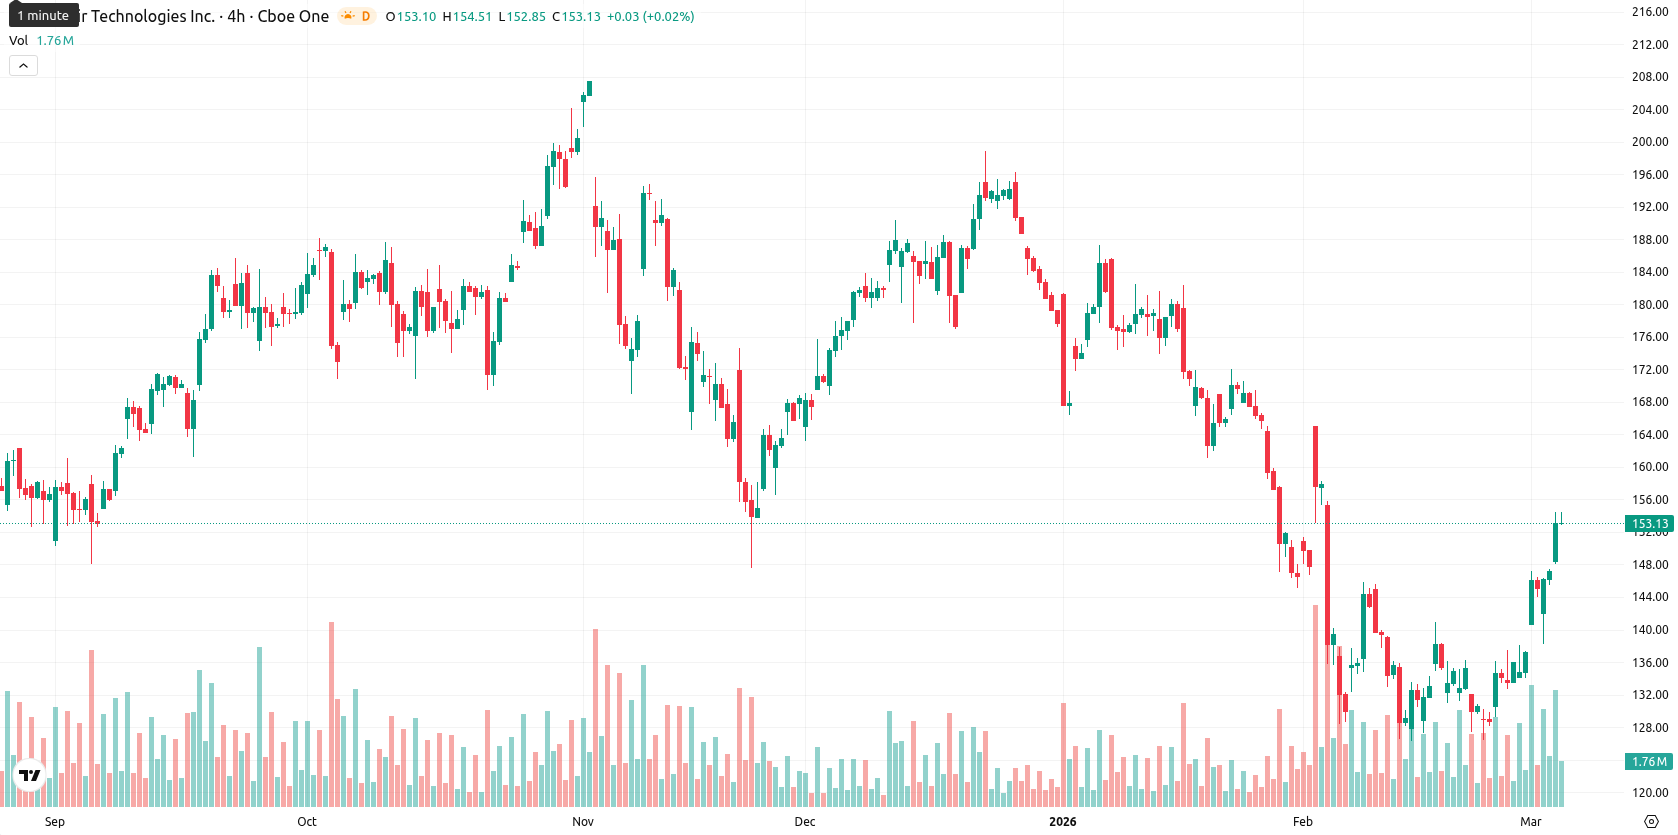
+0.83% for Palantir stock — Price rebounds after early gap down amid volatile session

Palantir Technologies Inc (PLTR) is trading at $154.44, up 0.83% for the day. The price is above its MA-20 of $136.76 but remains below the MA-50 at $158.97 and MA-200 at $161.80, indicating short-term bullish momentum while still facing medium- and longer-term resistance.
Highlights
- Palantir reported Q4 2025 revenue of $1.41 billion, up 70% year-over-year, driven by robust U.S. commercial demand and stable government contracts.
- Executive and institutional selling emerged as President Cohen offloaded shares and AustralianSuper reduced its position, signaling insider and major holder caution.
- PLTR trades in a $147–$160 range with overbought technicals and mixed momentum, pointing to consolidation and a higher probability of near-term downside.
Revenue surge and insider selling as defense role draws scrutiny
On March 3, 2026, Palantir reported fourth-quarter 2025 results with a 70% year-over-year revenue increase to $1.41 billion, driven by especially strong U.S. commercial growth and steady government contracts. The company also disclosed that President Stephen Andrew Cohen sold a significant number of shares last month, and major institutional holder AustralianSuper Pty Ltd reduced its stake in the third quarter. Additional attention is focused on Palantir's role as a defense software provider due to recent U.S.–Iran tensions and changing U.S. government AI vendor relationships.
Overbought signals and bearish divergence drive caution amid support at Kijun
PLTR is above its MA-20 but remains below the MA-50 and MA-200, with the Ichimoku Kijun at $147.90 offering immediate support. The Average Directional Index points to a moderate trend, while MACD on the daily timeframe signals strong bearish divergence. Oscillator readings show overbought conditions with RSI at 57.95, CCI above 200, and Stochastic RSI at 100, while Bull/Bear Power indicates sharp buyer dominance intraday. There was a gap down at the open, but the price rebounded toward the session's high, characterized by moderate volatility and persistent strength; however, the conflicting momentum and overbought signals highlight a divergence that calls for caution.
Downside bias likely as key trend indicators turn bearish
For the short term, the typical volatility band is expected between $147.00 and $160.00. Probabilities favor a decrease in price, as only one of the four key weekly trend indicators is bullish, making further upside less likely. PLTR is likely to consolidate within this range, holding between intraday support at $147.00 and resistance near $160.00. A sustained move above $160.00 could trigger a bullish breakout, while a dip below $147.00 would suggest more pronounced downside momentum.
Last time, analysts noted that Palantir Technologies is trading above its 20-day moving average but below both the 50- and 200-day averages, highlighting short-term upward momentum within a broader range of resistance levels. Current momentum indicators such as MACD, RSI, and Stoch RSI are mixed-to-overbought, suggesting heightened intraday volatility and limited near-term upside, with support around $137 and resistance near $150.


Latest Palantir News


-
 Afghanistan
-
 Albania
-
 Algeria
-
 Angola
-
 Argentina
-
 Armenia
-
 Australia
-
 Austria
-
 Azerbaijan
-
 Bahamas
-
 Bahrain
-
 Bangladesh
-
 Belarus
-
 Belgium
-
 Bolivia
-
 Botswana
-
 Brazil
-
 Brunei
-
 Bulgaria
-
 Cambodia
-
 Cameroon
-
 Canada
-
 Chile
Chile
-
 China
China
-
 Colombia
-
 Congo
Congo
-
 Costa Rica
-
 Cote d'Ivoire
-
 Croatia
-
 Cuba
Cuba
-
 Cyprus
-
 Czechia
-
 DR Congo
-
 Denmark
-
 Dominican Republic
-
 Ecuador
-
 Egypt
Egypt
-
 El Salvador
-
 Estonia
-
 Eswatini
-
 Ethiopia
-
 Finland
-
 France
-
 Georgia
-
 Germany
-
 Ghana
Ghana
-
 Greece
-
 Haiti
Haiti
-
 Hong Kong
-
 Hungary
-
 India
India
-
 Indonesia
-
 Iran, Islamic republic
-
 Iraq
Iraq
-
 Ireland
-
 Israel
-
 Italy
Italy
-
 Jamaica
-
 Japan
Japan
-
 Jordan
-
 Kazakhstan
-
 Kenya
Kenya
-
 Korea
Korea
-
 Kuwait
-
 Kyrgyzstan
-
 Laos
Laos
-
 Latvia
-
 Lebanon
-
 Lesotho
-
 Libya
Libya
-
 Lithuania
-
 Luxembourg
-
 Madagascar
-
 Malaysia
-
 Malta
Malta
-
 Mauritius
-
 Mexico
-
 Moldova
-
 Mongolia
-
 Montenegro
-
 Morocco
-
 Mozambique
-
 Myanmar
-
 Namibia
-
 Nepal
Nepal
-
 Netherlands
-
 New Zealand
-
 Nigeria
-
 North Macedonia
-
 Norway
-
 Oman
Oman
-
 Pakistan
-
 Palestine
-
 Panama
-
 Papua New Guinea
-
 Paraguay
-
 Peru
Peru
-
 Philippines
-
 Poland
-
 Portugal
-
 Puerto Rico
-
 Qatar
Qatar
-
 Reunion
-
 Romania
-
 Rwanda
-
 Saudi Arabia
-
 Serbia
-
 Singapore
-
 Slovakia
-
 Slovenia
-
 Somalia
-
 South Africa
-
 Spain
Spain
-
 Sri Lanka
-
 Sweden
-
 Switzerland
-
 Syria
Syria
-
 Taiwan
-
 Tajikistan
-
 Tanzania
-
 Thailand
-
 Trinidad and Tobago
-
 Tunisia
-
 Turkey
-
 UAE
UAE
-
 Uganda
-
 Ukraine
-
 United Kingdom
-
United States
-
 Uruguay
-
 Uzbekistan
-
 Venezuela
-
 Vietnam
-
 Yemen
Yemen
-
 Zambia
-
 Zimbabwe
- Forex
- Crypto
